Multi-timeframe confluence across 3 currencies—both the 30-minute and 4-hour charts are bearish 🔥
════════════════════
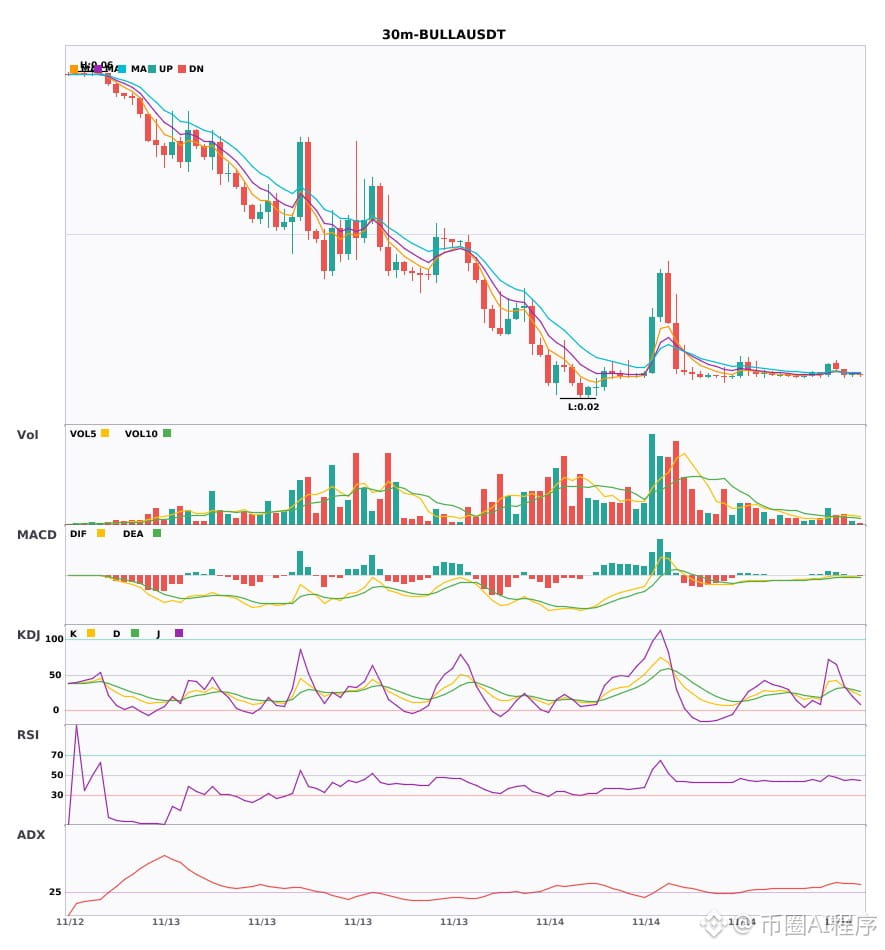
🟢 $BULLA 30-minute bearish signal
⚠️Technical analysis: 30-minute + 4-hour multi-timeframe confluence for a short: On the 30-minute chart, EMA5 crosses below EMA8, forming a bearish crossover; KDJ also crosses bearishly, with the K and D lines trending down. Volume expands by 1.3x, and the 4-hour bearish confluence is confirmed.
════════════════════
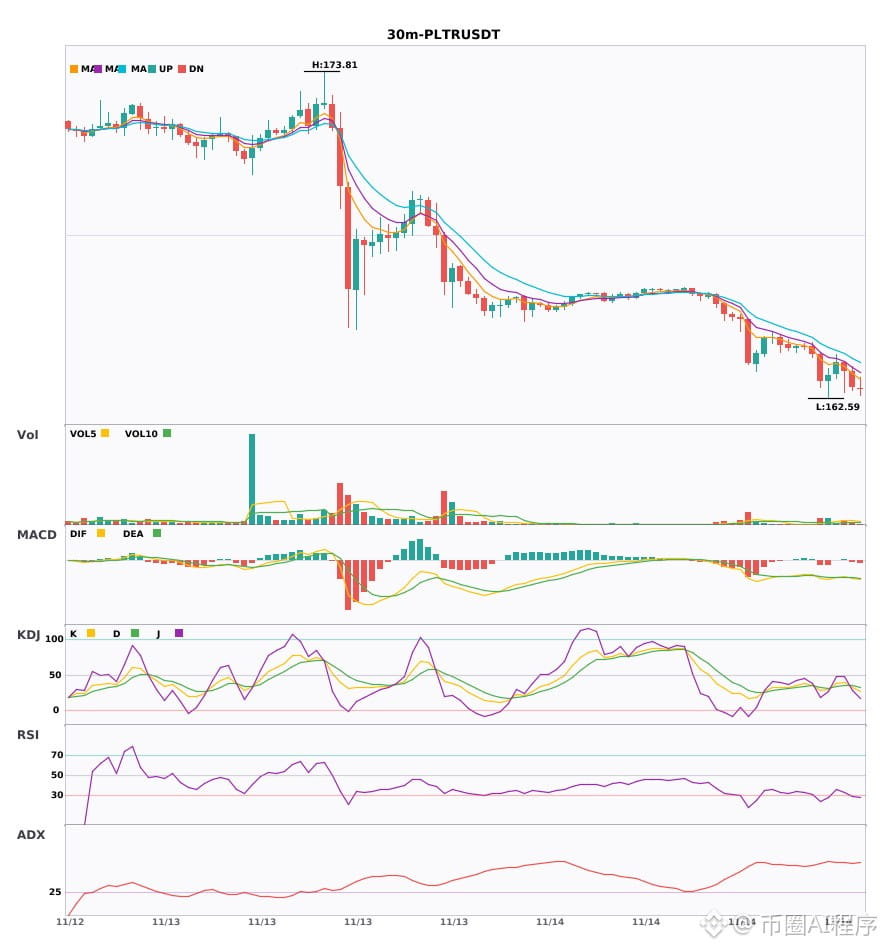
🟢 $PLTR 30-minute bearish signal
⚠️Technical analysis: 4-hour bearish trend + 30-minute confluence confirmed! MACD forms a bearish crossover with expanding volume and larger green bars; moving averages are bearishly aligned; KDJ has crossed bearishly but is not oversold. Short-term outlook is bearish.
════════════════════
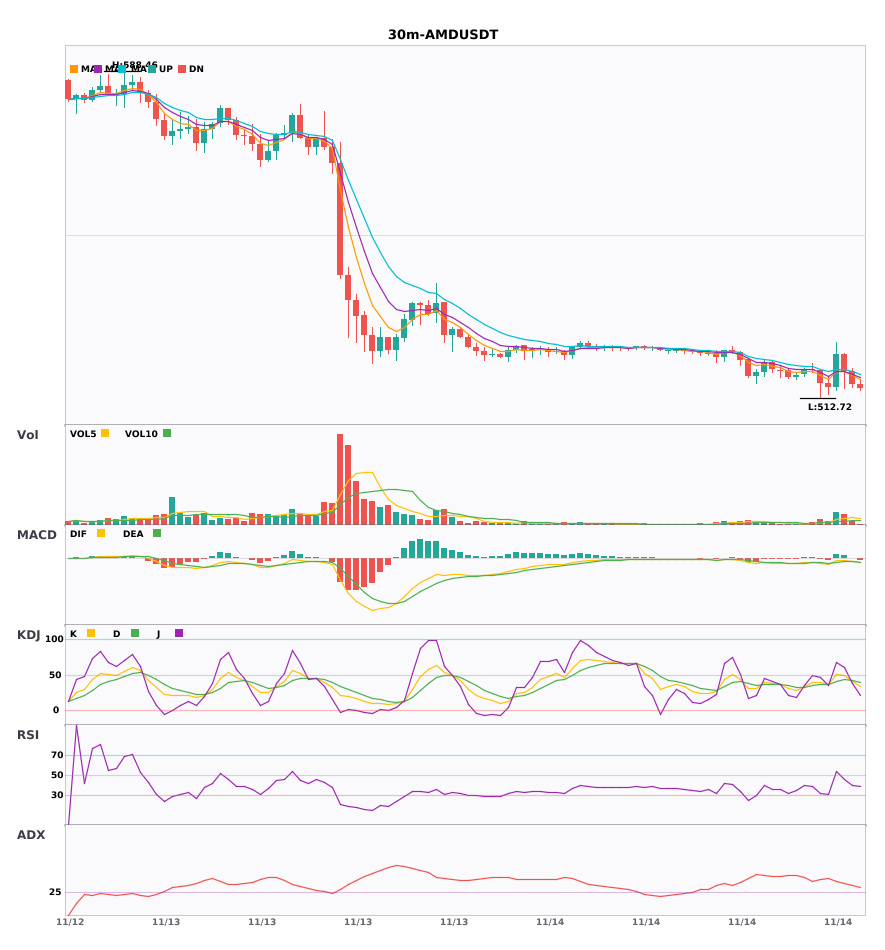
🟢 $AMD 30-minute bearish signal
⚠️Multi-timeframe confluence! The 30-minute MACD forms a bearish crossover below zero with expanding volume + the 4-hour bearish trend is confirmed. Moving averages are bearishly aligned; KDJ has crossed down but is not in oversold territory. Volume surges by 2.6x. Bearish outlook.
════════════════════
🔔 Follow for first-hand market updates 🔔
#多周期共振 #BULLA #PLTR #AMD
📌 When trading, pay attention to whether the candlestick patterns align.
════════════════════
🟢 $BULLA 30-minute bearish signal
⚠️Technical analysis: 30-minute + 4-hour multi-timeframe confluence for a short: On the 30-minute chart, EMA5 crosses below EMA8, forming a bearish crossover; KDJ also crosses bearishly, with the K and D lines trending down. Volume expands by 1.3x, and the 4-hour bearish confluence is confirmed.
════════════════════
🟢 $PLTR 30-minute bearish signal
⚠️Technical analysis: 4-hour bearish trend + 30-minute confluence confirmed! MACD forms a bearish crossover with expanding volume and larger green bars; moving averages are bearishly aligned; KDJ has crossed bearishly but is not oversold. Short-term outlook is bearish.
════════════════════
🟢 $AMD 30-minute bearish signal
⚠️Multi-timeframe confluence! The 30-minute MACD forms a bearish crossover below zero with expanding volume + the 4-hour bearish trend is confirmed. Moving averages are bearishly aligned; KDJ has crossed down but is not in oversold territory. Volume surges by 2.6x. Bearish outlook.
════════════════════
🔔 Follow for first-hand market updates 🔔
#多周期共振 #BULLA #PLTR #AMD
📌 When trading, pay attention to whether the candlestick patterns align.