BTC’s three consecutive bearish candles are more worthy of caution than “oversold.”
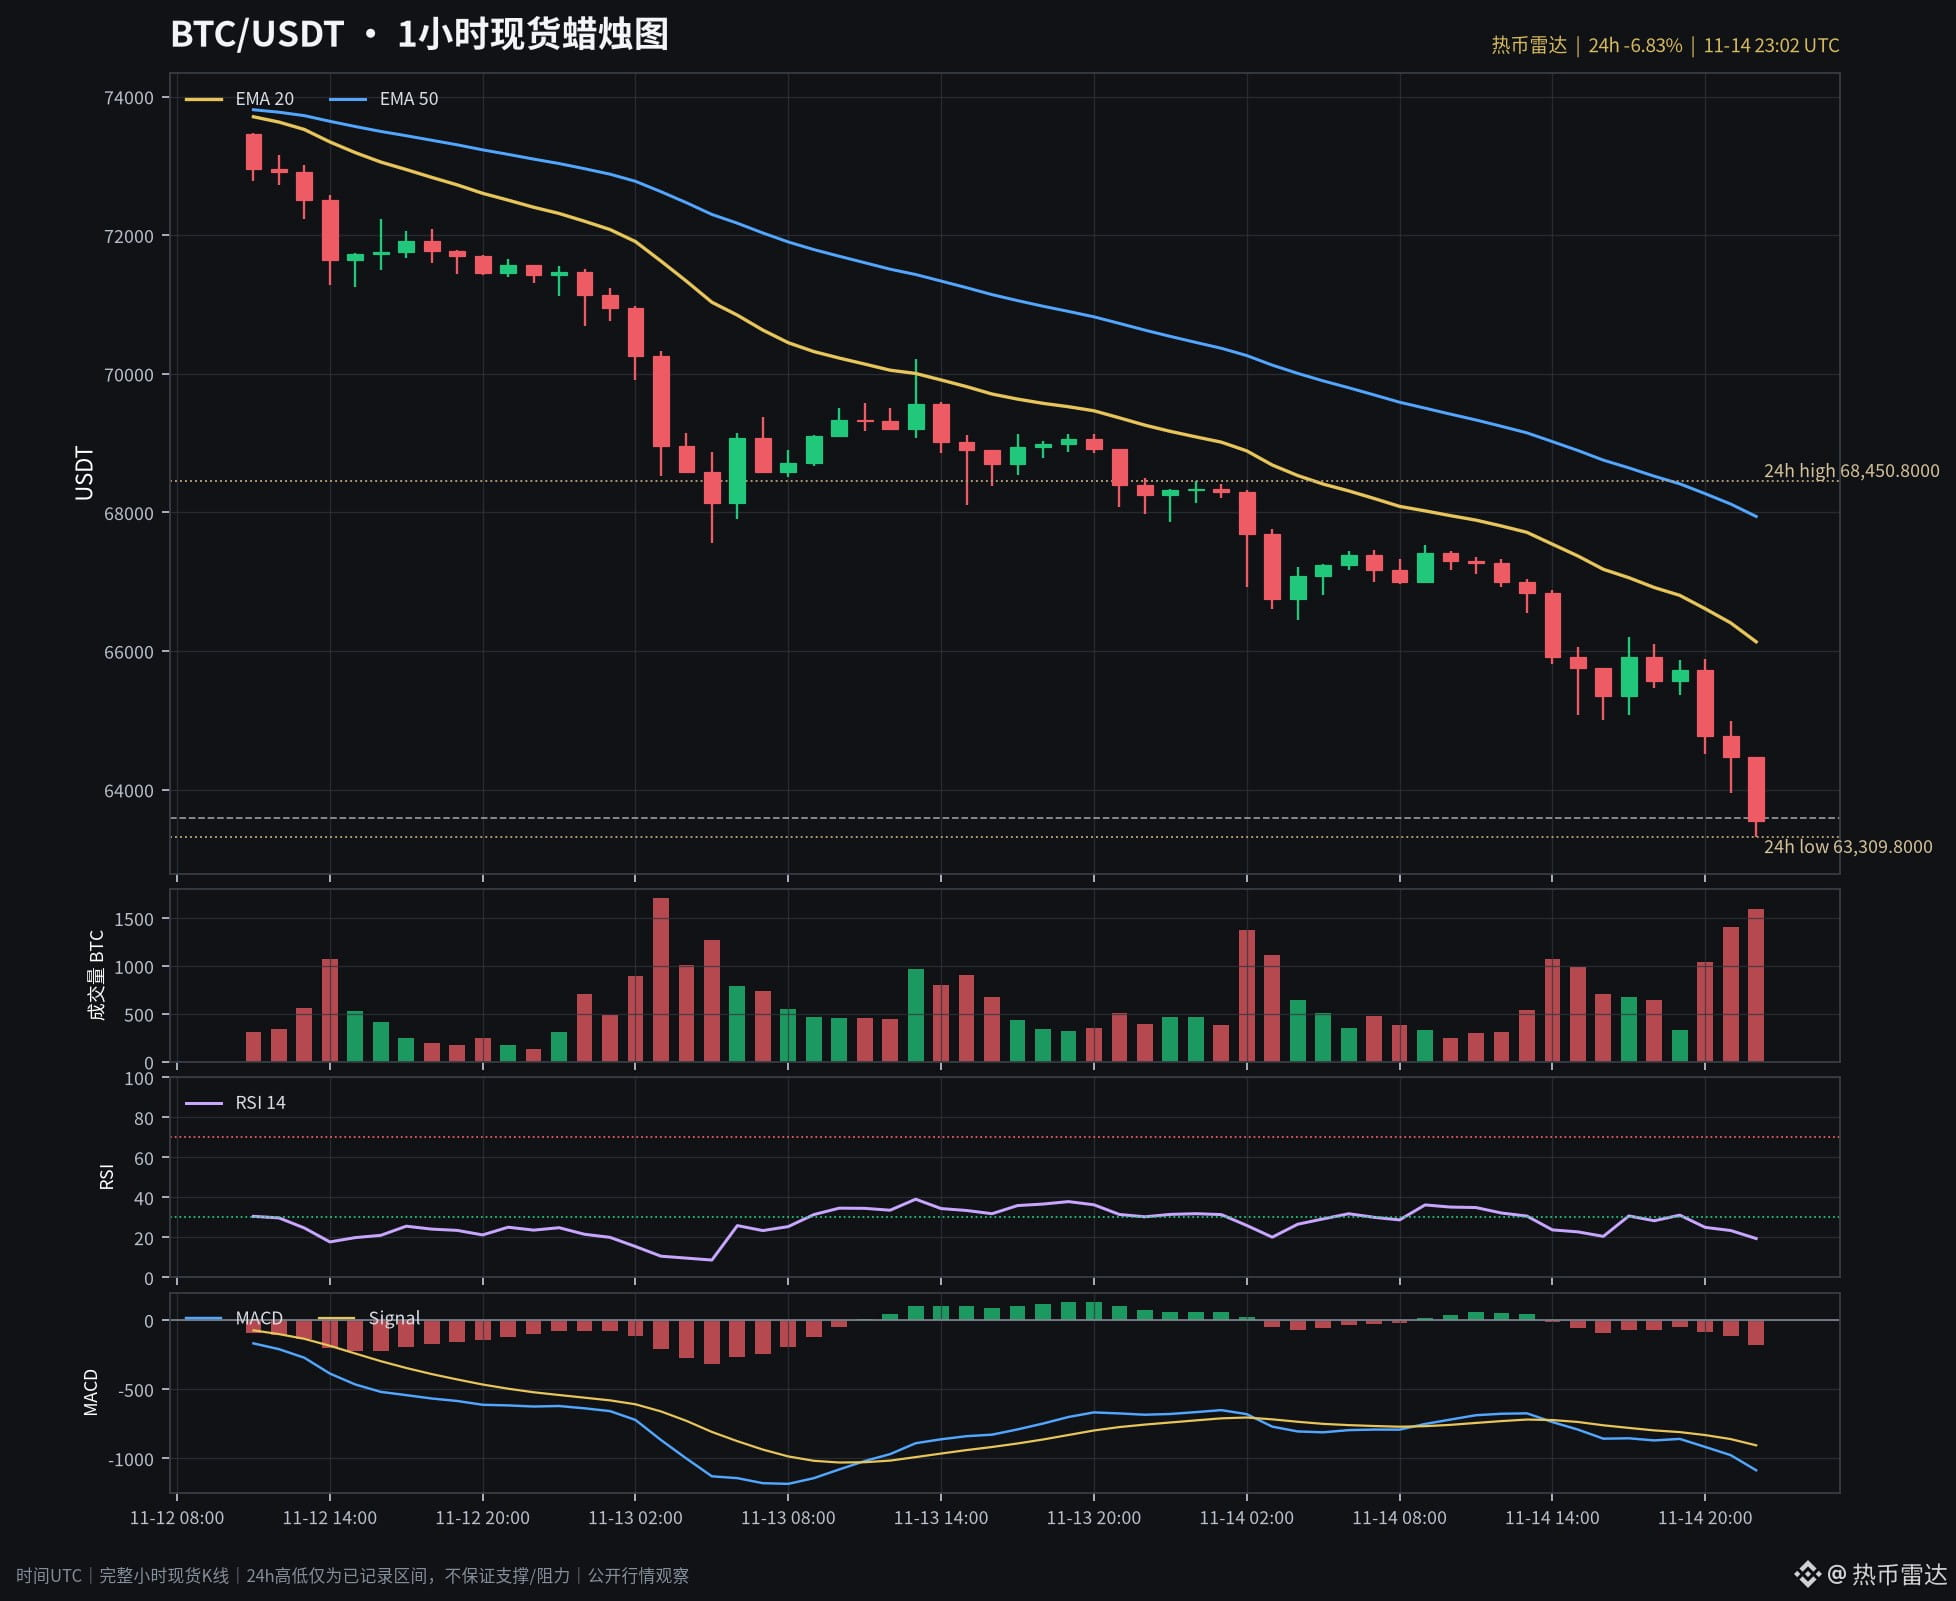
From 20:00–23:00 UTC on November 14, three full hourly candles closed lower in succession: 65,732→64,771→64,468→63,542 USDT, with cumulative losses of 3.33%, and hourly trading volume also increased candle by candle. This is an observation of price and volume, not an identification of capital flow.
At 23:02 UTC, the spot snapshot was around 63,588, down 6.83% over 24 hours. RSI(14) was about 19.4, but MACD was still below the signal line; EMA20 was around 66,133, and the distance to recovery remained.
First, watch whether the next full hourly candles can reclaim the open of the most recent bearish candle at 64,468 and stop making new lows; if even this step has not been completed, do not treat a small rebound as a reversal. On the downside, if the recorded low of 63,310 is broken and a retest fails to reclaim it, the basis for stabilization weakens further. This low does not guarantee support, and moving averages can change.
The chart is a 1-hour spot candlestick chart; BTCUSDT Perp is a separate perpetual market card, and the coin label is the spot entry. For market observation only, not investment advice.
$BTC
From 20:00–23:00 UTC on November 14, three full hourly candles closed lower in succession: 65,732→64,771→64,468→63,542 USDT, with cumulative losses of 3.33%, and hourly trading volume also increased candle by candle. This is an observation of price and volume, not an identification of capital flow.
At 23:02 UTC, the spot snapshot was around 63,588, down 6.83% over 24 hours. RSI(14) was about 19.4, but MACD was still below the signal line; EMA20 was around 66,133, and the distance to recovery remained.
First, watch whether the next full hourly candles can reclaim the open of the most recent bearish candle at 64,468 and stop making new lows; if even this step has not been completed, do not treat a small rebound as a reversal. On the downside, if the recorded low of 63,310 is broken and a retest fails to reclaim it, the basis for stabilization weakens further. This low does not guarantee support, and moving averages can change.
The chart is a 1-hour spot candlestick chart; BTCUSDT Perp is a separate perpetual market card, and the coin label is the spot entry. For market observation only, not investment advice.
$BTC