
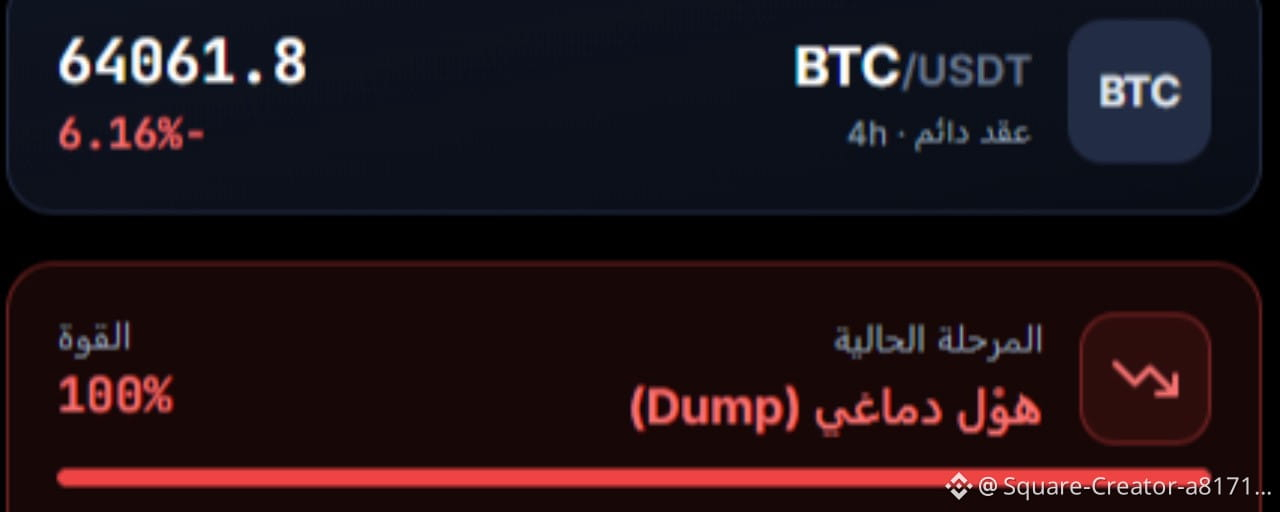

📉 Bitcoin analysis: Is the market in a real "capitulation" phase?
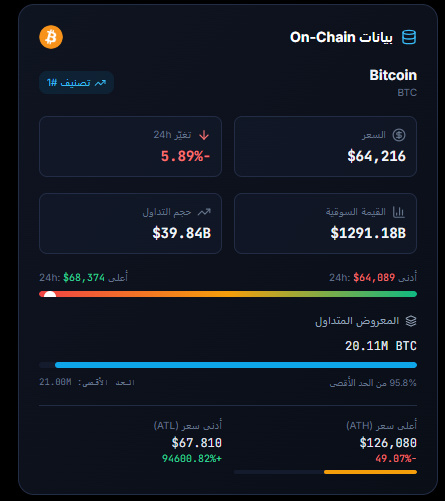
📊 Current data:
• Price: ~$64,216 (-5.89%)
• Market cap: $1.29 trillion
• 24h low: $64,089
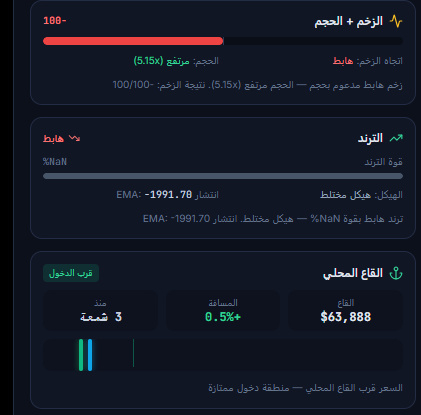
• Local bottom: $63,888 (very close)
━━━━━━━━━━━━━━━
🔍 What are the indicators saying?
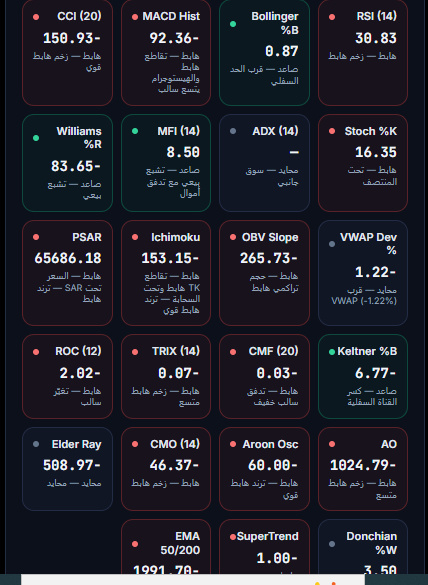
🔴 All indicators are negative:
• RSI: 30.83 (nearing oversold territory)
• Stoch: 16.35 (oversold)
• MACD: bearish crossover
• CCI: -150.93 (sharp decline)
• PSAR: Price is below SAR
• SuperTrend: bearish
• EMA 50/200: bearish crossover
📊 Volume and momentum:
• Trading volume: $39.84B
• Momentum: bearish (5.15x above average)
• Whales: evenly matched (3.45x)... they don't agree
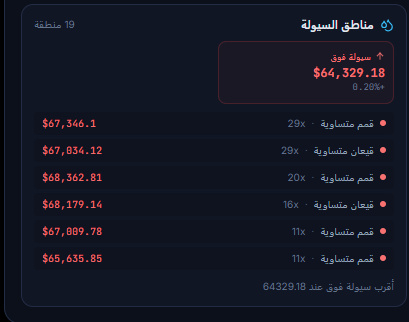
📊 Liquidity zones:
• Nearest liquidity above: $64,329
• Liquidity below: $65,635 - $68,362
• Price is near a local bottom: $63,888
💡 What does this mean?
✅ The market is in a "brain-melting" phase (Dump)
✅ All indicators point to strong selling pressure
✅ Price is near a local bottom (potential bounce?)
⚠️ But that's not guaranteed... it could drop further
📌 Bottom line:
Bitcoin is in a very sensitive zone. The indicators are negative, but the price is near strong support. Anyone entering now is playing in the "danger zone" or the "opportunity zone"... depending on their capital management.

#Crypto #تداول_العملات_المشفرة #BTC🔥🔥🔥🔥🔥 #BitcoinForecast #cryptouniverseofficial #TradingStrategies💼💰