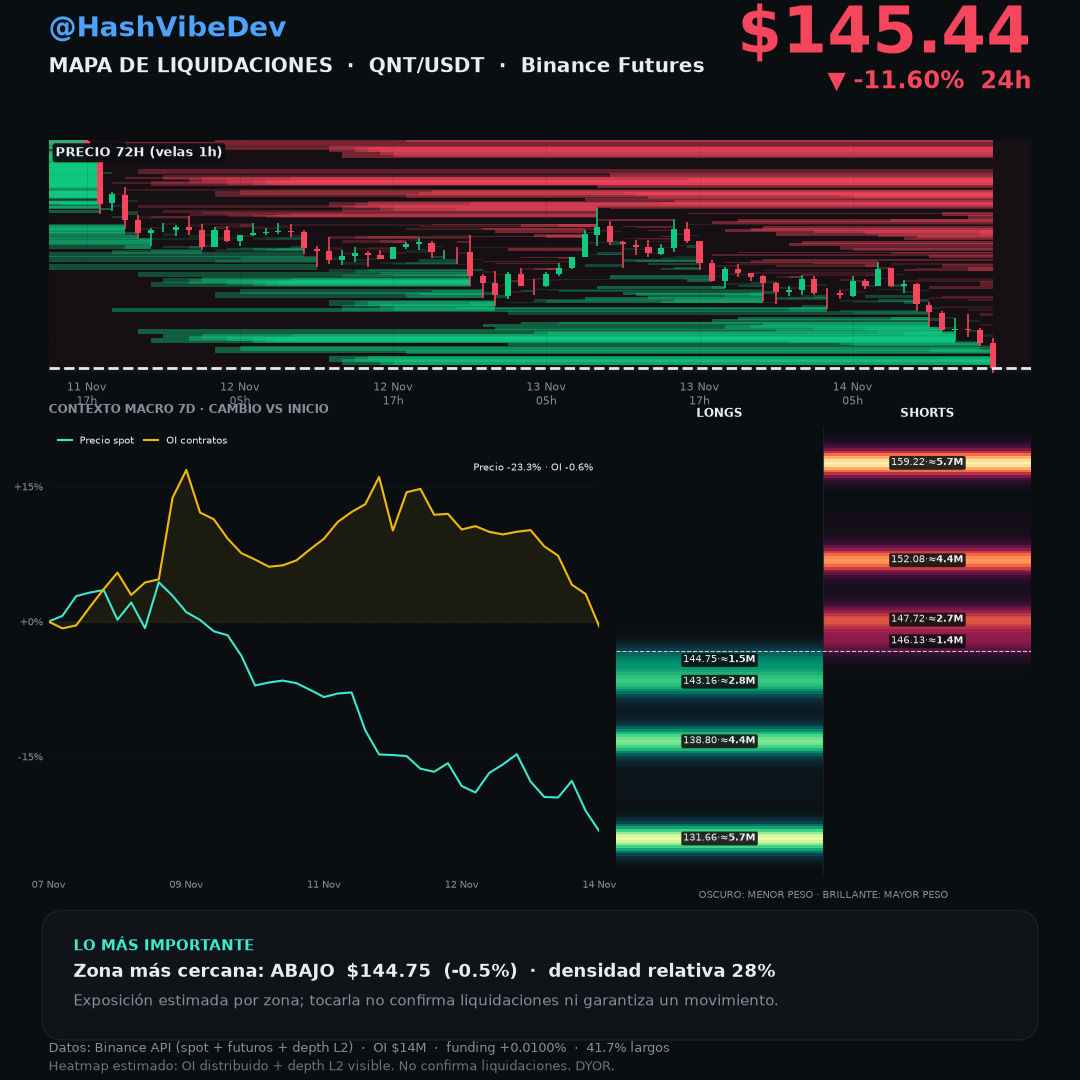
After the latest map, QNT lost $165.62 on Nov 13 at 14:15 UTC, rebounded to $167.33 at 19:45 UTC (one cent below $167.34), and hit $144.77 on Nov 14 at 20:30 UTC.
At 20:36 UTC, it was trading at $145.44 (-11.60% in 24 h), within the $144.77–$164.97 range. My closed trade was a 4x QNTUSDT Perpetual short; the card from Nov 14 at 17:32:07 shows +118.01%, an entry of 189.061111, and a last price of 145.980000. Over 24 h, OI in contracts fell 11.6% and its notional value fell 20.5%; the taker buy/sell ratio was 0.92, and 0.80 in the latest hourly reading. Selling volume predominated. Over 7 days, the price fell 23.3% and OI in contracts fell 0.6%; these are changes in exposure and do not identify who opened or closed positions.
The map estimates nearby zones at $144.75 below (≈$1.5M) and $146.13 above (≈$1.4M). These are estimated exposures, not observed liquidations.
Will it react at $144.75 or extend the decline toward $143.16? Follow the series.
#QNT $QNT
This is not financial advice. DYOR.
At 20:36 UTC, it was trading at $145.44 (-11.60% in 24 h), within the $144.77–$164.97 range. My closed trade was a 4x QNTUSDT Perpetual short; the card from Nov 14 at 17:32:07 shows +118.01%, an entry of 189.061111, and a last price of 145.980000. Over 24 h, OI in contracts fell 11.6% and its notional value fell 20.5%; the taker buy/sell ratio was 0.92, and 0.80 in the latest hourly reading. Selling volume predominated. Over 7 days, the price fell 23.3% and OI in contracts fell 0.6%; these are changes in exposure and do not identify who opened or closed positions.
The map estimates nearby zones at $144.75 below (≈$1.5M) and $146.13 above (≈$1.4M). These are estimated exposures, not observed liquidations.
Will it react at $144.75 or extend the decline toward $143.16? Follow the series.
#QNT $QNT
This is not financial advice. DYOR.