📉 Has BTC reached a potential reversal zone? A move worth watching carefully!
💡 Quick technical analysis (daily timeframe):
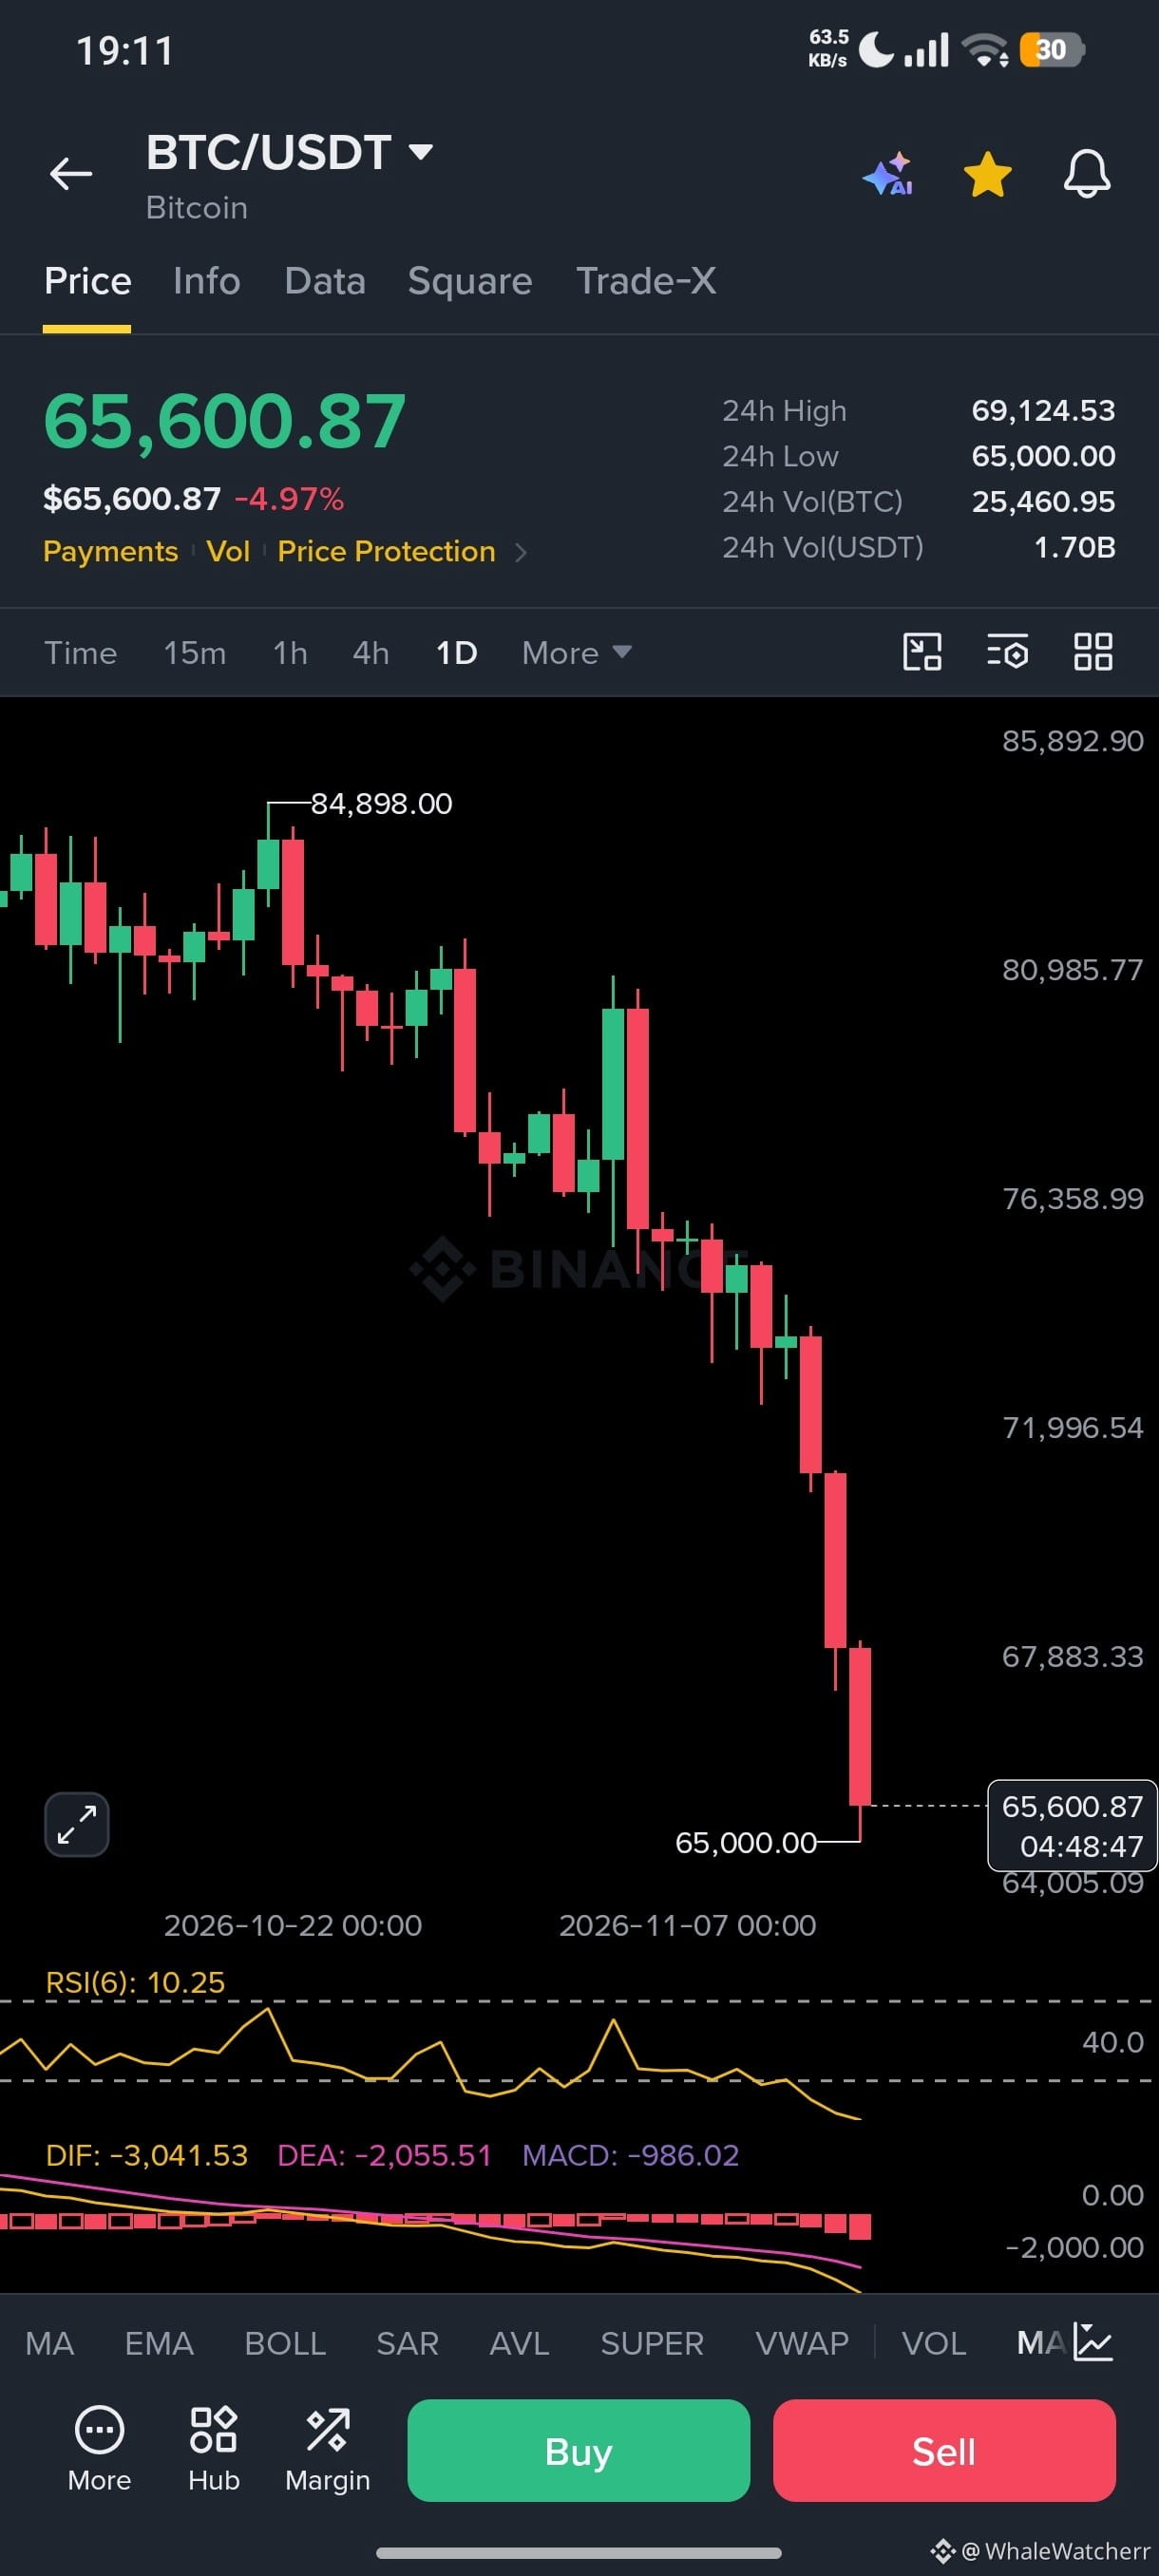
⚠️ Sharp, sustained decline! After peaking at 84,898, BTC fell sharply to touch 65,000, and the price is now at 65,600.87, down 4.97% in 24 hours, following a series of large red daily candles that successively broke through 76,358, 71,996, and 67,883.
$BTC
✅ Potential bounce opportunity! The Relative Strength Index (RSI) is at 10.25, meaning it is in extremely oversold territory, which could set the stage for a technical bounce. However, the RSI can remain low for a while during strong downtrends, so we shouldn’t consider it a buy signal on its own.
⚠️ MACD is negative! The DIF line is at -3,041.53, below DEA at -2,055.51, and the histogram is red and expanding, meaning downward momentum remains dominant.
$BTC
🚀 Expected scenario:
If BTC holds the 65,000 support and daily candles close above 67,883, we could see a bounce toward 71,996 and then 76,358! But if 65,000 is clearly broken on a closing basis, the decline could continue toward 64,005 and lower.
$BTC
🔥 Is BTC ready to bounce?!
With trading volume reaching 1.70B USDT over 24 hours, we could see sharp volatility, as the move may quickly reverse in either direction! Are you ready to watch? 🌊
📢 Share your thoughts! Do you expect BTC to bounce above 68,000? 🚀👇
💎 Like and share this post if you’re watching BTC’s next move!
💡 Quick technical analysis (daily timeframe):
⚠️ Sharp, sustained decline! After peaking at 84,898, BTC fell sharply to touch 65,000, and the price is now at 65,600.87, down 4.97% in 24 hours, following a series of large red daily candles that successively broke through 76,358, 71,996, and 67,883.
$BTC
✅ Potential bounce opportunity! The Relative Strength Index (RSI) is at 10.25, meaning it is in extremely oversold territory, which could set the stage for a technical bounce. However, the RSI can remain low for a while during strong downtrends, so we shouldn’t consider it a buy signal on its own.
⚠️ MACD is negative! The DIF line is at -3,041.53, below DEA at -2,055.51, and the histogram is red and expanding, meaning downward momentum remains dominant.
$BTC
🚀 Expected scenario:
If BTC holds the 65,000 support and daily candles close above 67,883, we could see a bounce toward 71,996 and then 76,358! But if 65,000 is clearly broken on a closing basis, the decline could continue toward 64,005 and lower.
$BTC
🔥 Is BTC ready to bounce?!
With trading volume reaching 1.70B USDT over 24 hours, we could see sharp volatility, as the move may quickly reverse in either direction! Are you ready to watch? 🌊
📢 Share your thoughts! Do you expect BTC to bounce above 68,000? 🚀👇
💎 Like and share this post if you’re watching BTC’s next move!