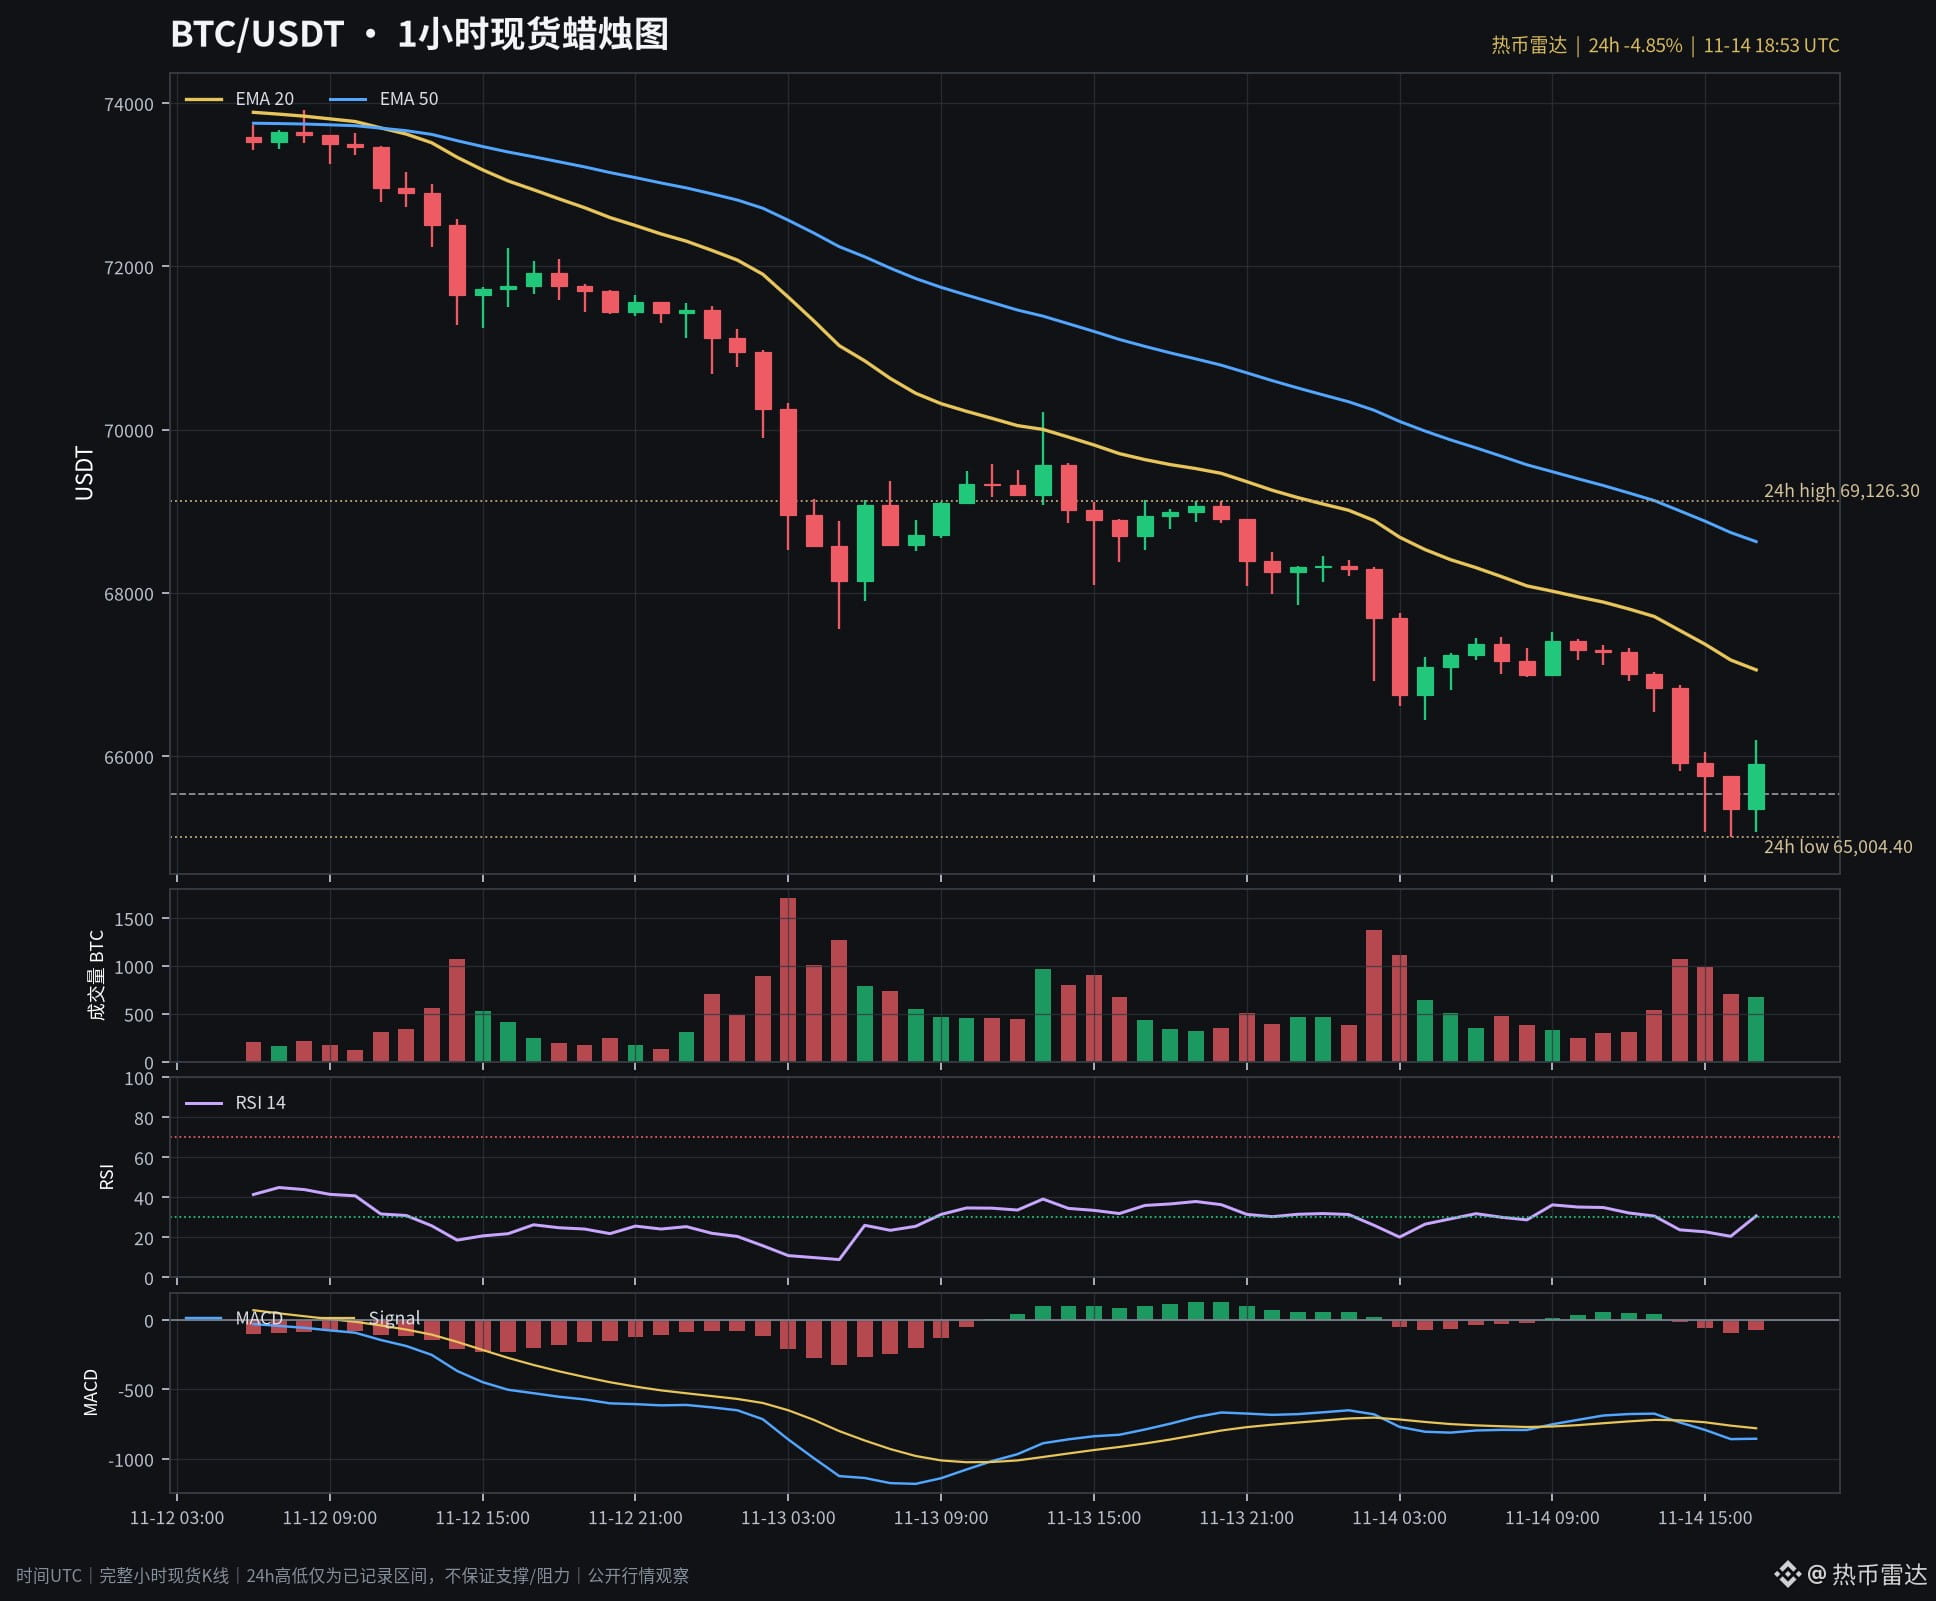
One bullish rebound candle in BTC is not enough to reverse the downtrend structure.
As of November 14, 18:53 UTC, the spot snapshot price was 65,542, down 4.85% over 24 hours. Among a sample of six major coins across two exchanges, BTC had the highest estimated trading volume, at approximately $1.185 billion. High activity does not mean funds are flowing in only one direction.
1-hour structure: The complete 17:00–18:00 UTC candle closed at 65,909, with RSI(14) back near 30.7. However, the close was still below EMA20 at 67,058 and EMA50 at 68,629, and MACD remained below the signal line. This looks more like an attempted recovery after a sharp drop than confirmation of a trend reversal.
Watch 65,004 below: this was the 24-hour low recorded at the time of the snapshot; it is not guaranteed to act as support. If a complete hourly candle breaks below it and a retest fails to reclaim it, the risk of continued weakness increases.
Above, first watch whether price can reclaim EMA20, then EMA50. If the rebound still cannot close back above the short-term moving averages, the recovery remains weak. Moving averages change as new candles form.
The chart was drawn using complete hourly spot candles. BTCUSDT “Perp” is a public perpetual-market data card, distinct from the spot price and the spot entry under the coin label; it is not a record of personal holdings or profits and losses.
This does not predict that prices must rise or fall and is not a buy or sell recommendation. Hot Coin Radar only watches whether the next complete candle can change the structure.
$BTC
As of November 14, 18:53 UTC, the spot snapshot price was 65,542, down 4.85% over 24 hours. Among a sample of six major coins across two exchanges, BTC had the highest estimated trading volume, at approximately $1.185 billion. High activity does not mean funds are flowing in only one direction.
1-hour structure: The complete 17:00–18:00 UTC candle closed at 65,909, with RSI(14) back near 30.7. However, the close was still below EMA20 at 67,058 and EMA50 at 68,629, and MACD remained below the signal line. This looks more like an attempted recovery after a sharp drop than confirmation of a trend reversal.
Watch 65,004 below: this was the 24-hour low recorded at the time of the snapshot; it is not guaranteed to act as support. If a complete hourly candle breaks below it and a retest fails to reclaim it, the risk of continued weakness increases.
Above, first watch whether price can reclaim EMA20, then EMA50. If the rebound still cannot close back above the short-term moving averages, the recovery remains weak. Moving averages change as new candles form.
The chart was drawn using complete hourly spot candles. BTCUSDT “Perp” is a public perpetual-market data card, distinct from the spot price and the spot entry under the coin label; it is not a record of personal holdings or profits and losses.
This does not predict that prices must rise or fall and is not a buy or sell recommendation. Hot Coin Radar only watches whether the next complete candle can change the structure.
$BTC