🚨 BITCOIN BELOW $66K — IS SELLING PRESSURE APPROACHING EXHAUSTION?
Bitcoin ( $BTC) trades around $65,711, down approximately 4.6%.
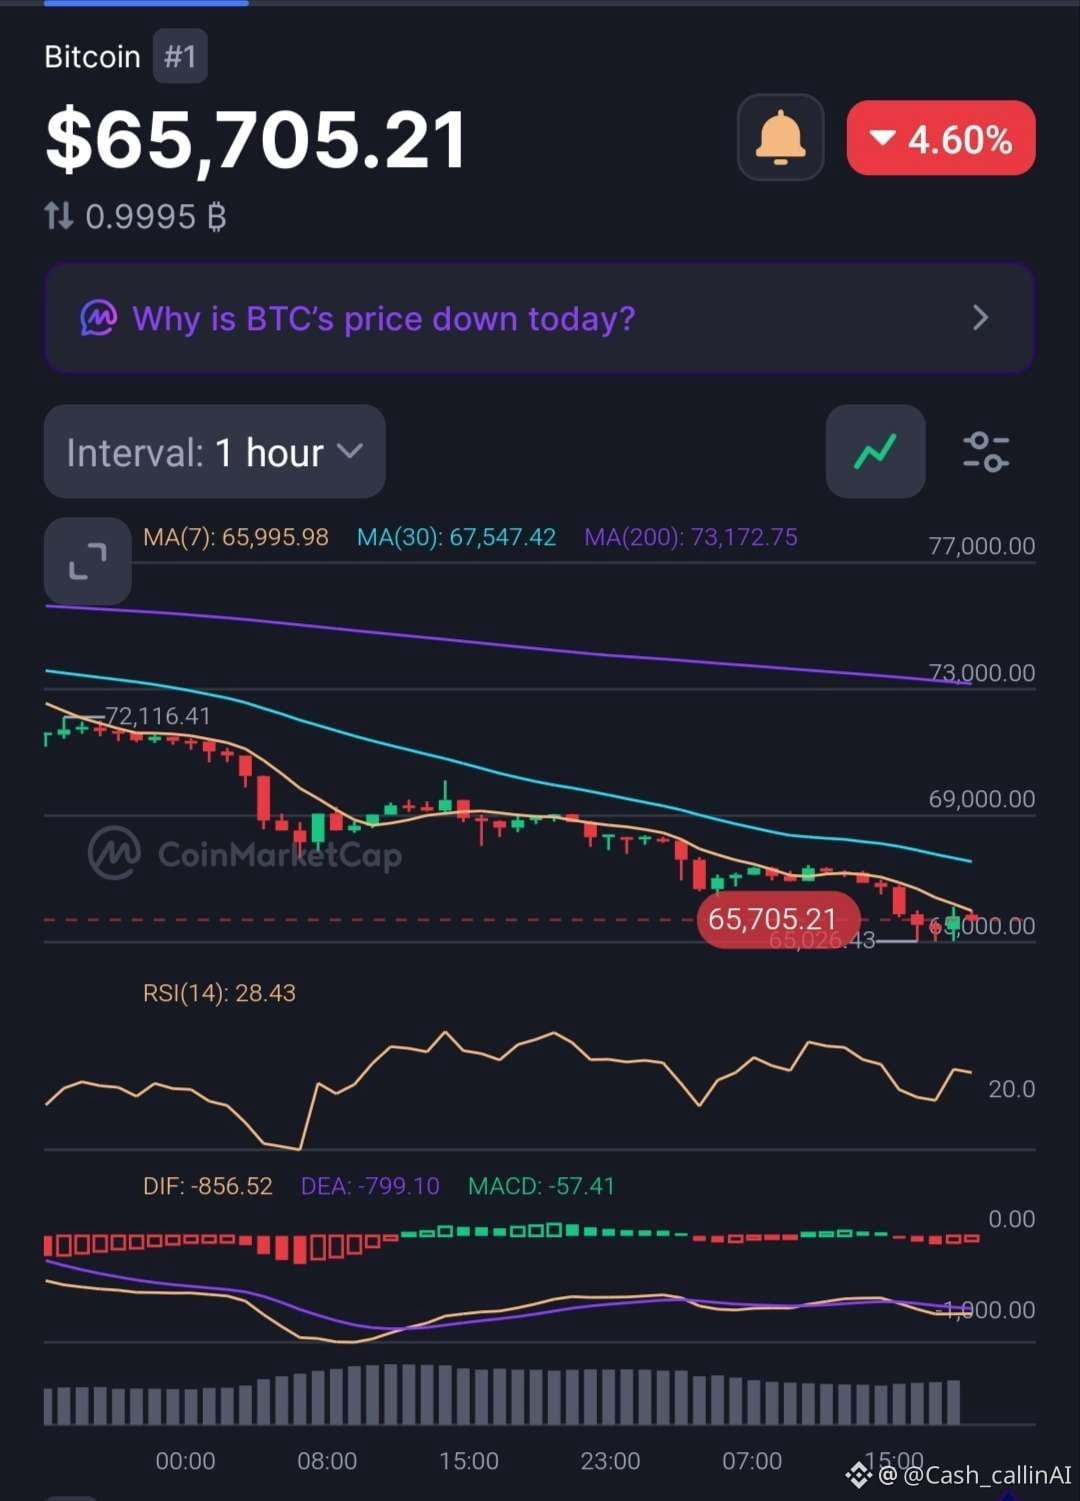
The hourly RSI has fallen below 30, but an oversold market does not automatically mean a bottom is in.
📊 1H CHART
• RSI: 28.43
• MACD histogram: -57.41
• MA(7): $65,995.98
• MA(30): $67,547.42
• MA(200): $73,172.75
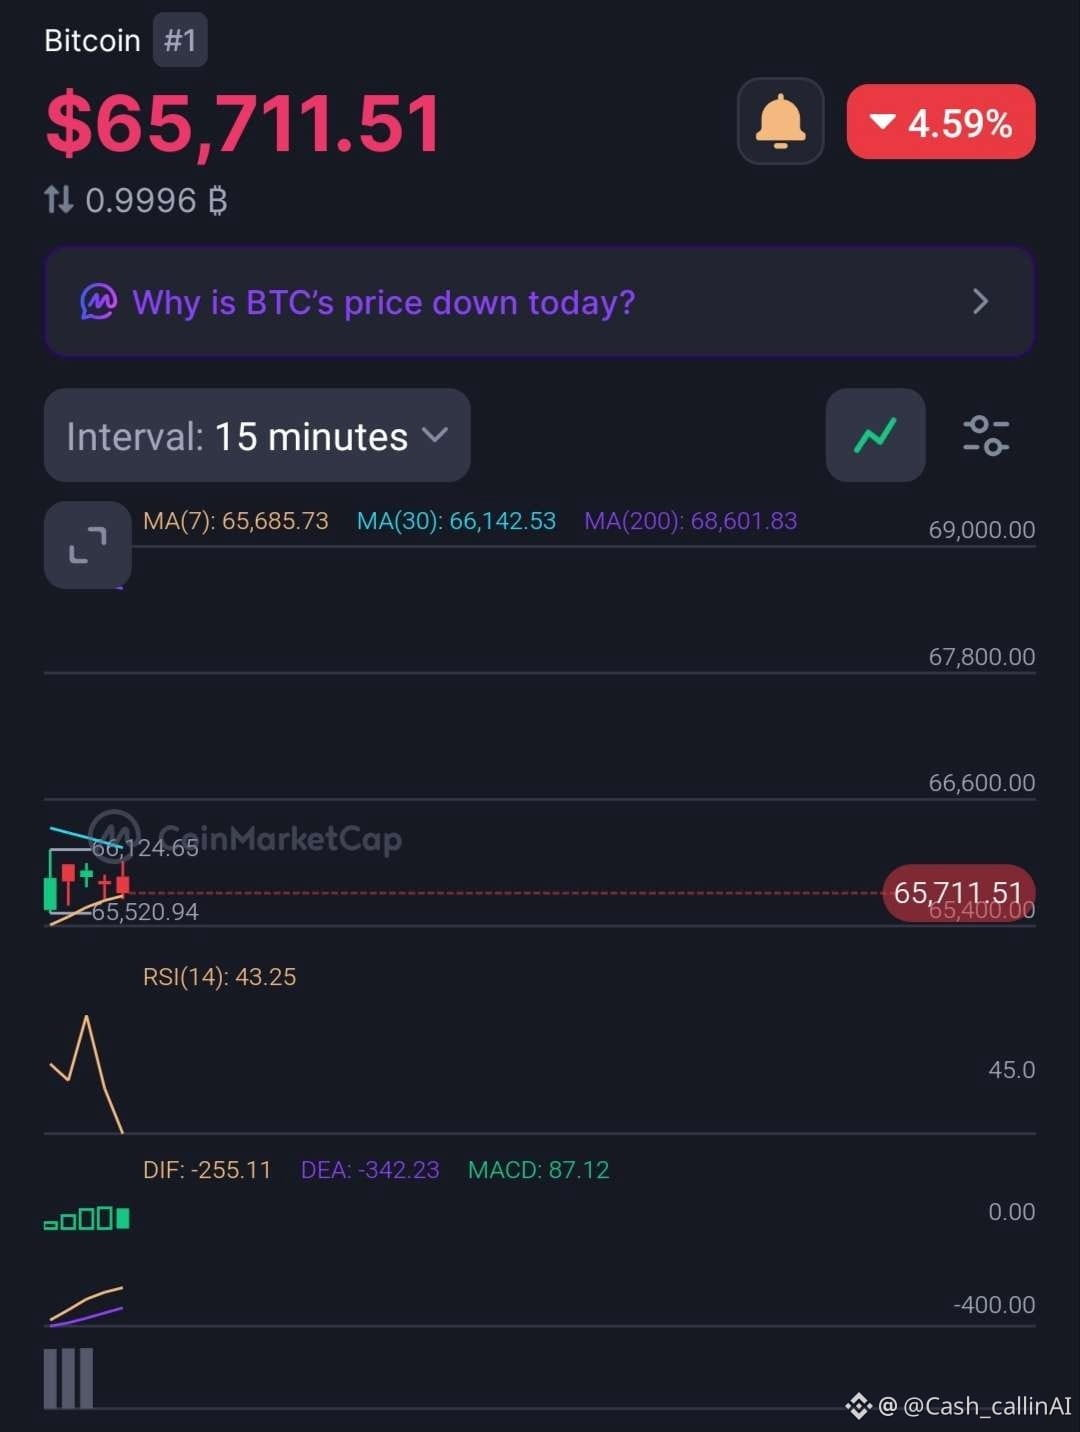
📊 15M CHART
• RSI: 43.25
• MACD histogram: +87.12
• MA(7): $65,685.73
• MA(30): $66,142.53
• MA(200): $68,601.83
🔍 WHAT STANDS OUT?
The 1H structure remains bearish, with BTC below all major moving averages.
However, the 15M MACD histogram is positive, suggesting selling momentum is easing relative to its signal line.
This is an early stabilisation signal, not a confirmed reversal.
📍 LEVELS TO WATCH
• $65,028 — recent 1H low.
• $65,521 — recent 15M low.
• $66,142 — initial recovery hurdle.
• $67,547 — 1H MA(30).
📊 MARKET SNAPSHOT
• Market Cap: $1.32T
• 24H Volume: $34.64B (-19.48%)
• YTD: -24.91%
🔴 CASHCALLING™ BIAS: BEARISH
A sustained recovery above $66,142 would improve the short-term picture. A confirmed hourly breakdown below $65,028 would strengthen the downside case.
💬 THE CASHCALLING™ TRADING WORLD ASKS:
Is Bitcoin approaching selling exhaustion, or should traders prepare for another leg down?
🟢 Relief bounce?
🔴 Further downside?
⚖️ More consolidation?
Share your analysis. Let's discuss the levels, not just the candles.
🌍 Welcome to the CashCalling™ Trading World.
CashCalling™ | Levels, not slogans.niz
Bitcoin ( $BTC) trades around $65,711, down approximately 4.6%.
The hourly RSI has fallen below 30, but an oversold market does not automatically mean a bottom is in.
📊 1H CHART
• RSI: 28.43
• MACD histogram: -57.41
• MA(7): $65,995.98
• MA(30): $67,547.42
• MA(200): $73,172.75
📊 15M CHART
• RSI: 43.25
• MACD histogram: +87.12
• MA(7): $65,685.73
• MA(30): $66,142.53
• MA(200): $68,601.83
🔍 WHAT STANDS OUT?
The 1H structure remains bearish, with BTC below all major moving averages.
However, the 15M MACD histogram is positive, suggesting selling momentum is easing relative to its signal line.
This is an early stabilisation signal, not a confirmed reversal.
📍 LEVELS TO WATCH
• $65,028 — recent 1H low.
• $65,521 — recent 15M low.
• $66,142 — initial recovery hurdle.
• $67,547 — 1H MA(30).
📊 MARKET SNAPSHOT
• Market Cap: $1.32T
• 24H Volume: $34.64B (-19.48%)
• YTD: -24.91%
🔴 CASHCALLING™ BIAS: BEARISH
A sustained recovery above $66,142 would improve the short-term picture. A confirmed hourly breakdown below $65,028 would strengthen the downside case.
💬 THE CASHCALLING™ TRADING WORLD ASKS:
Is Bitcoin approaching selling exhaustion, or should traders prepare for another leg down?
🟢 Relief bounce?
🔴 Further downside?
⚖️ More consolidation?
Share your analysis. Let's discuss the levels, not just the candles.
🌍 Welcome to the CashCalling™ Trading World.
CashCalling™ | Levels, not slogans.niz