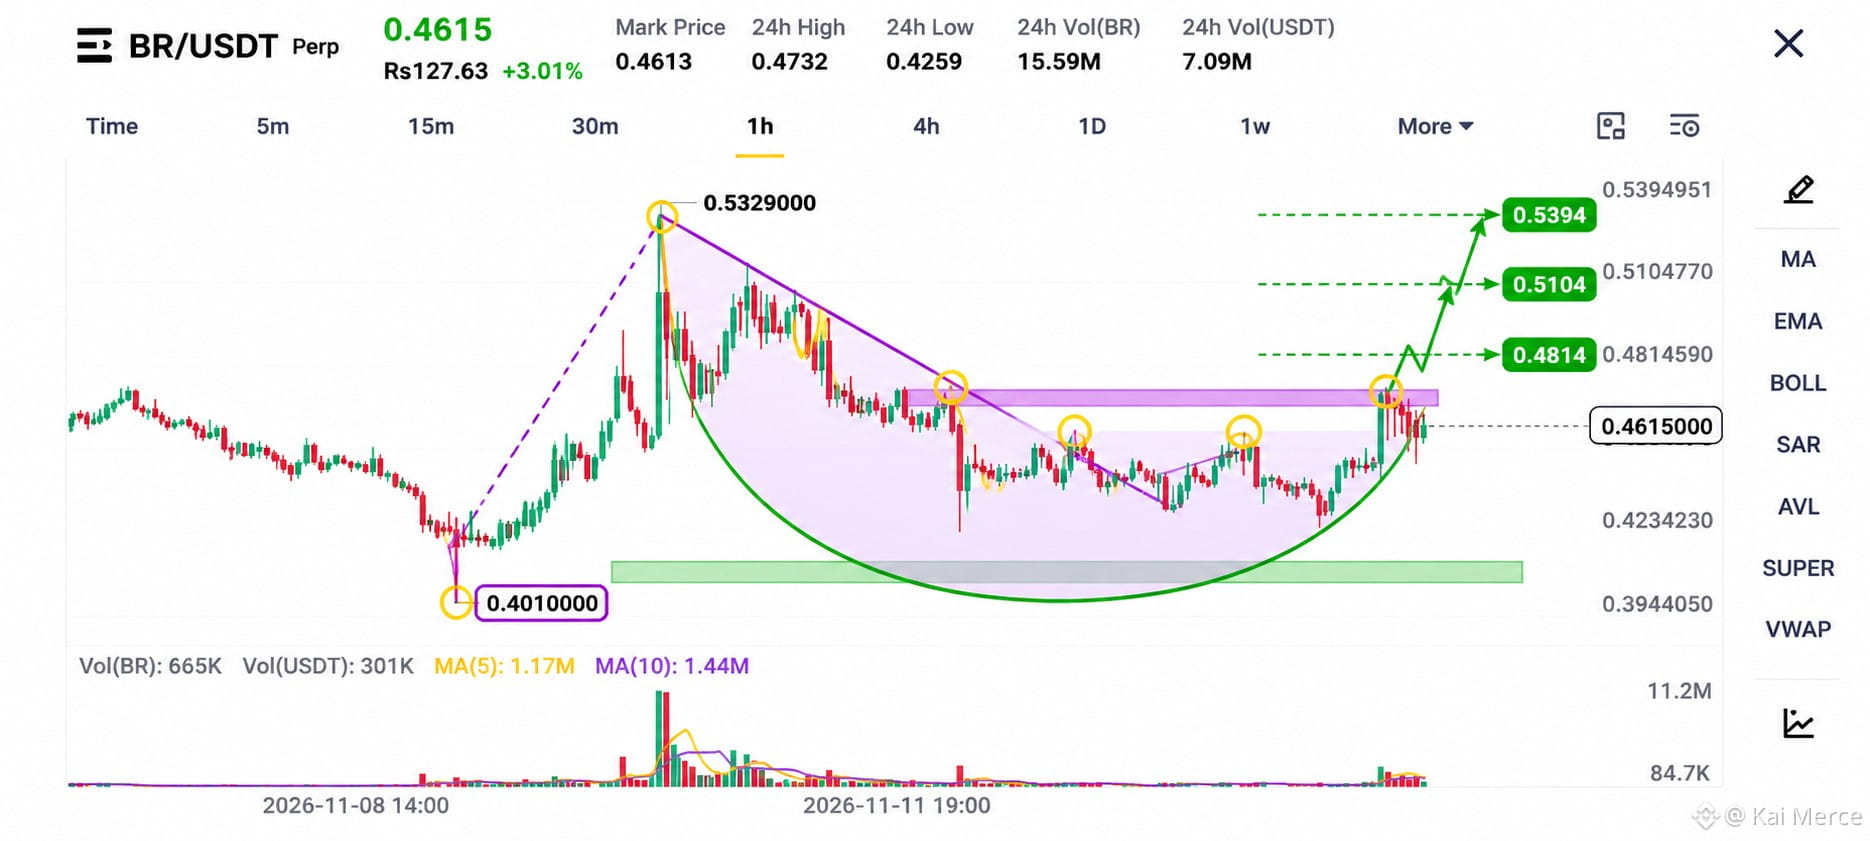

$BR A Rounded Recovery Structure Puts the Next Resistance Break in Focus
Long Setup
Entry Zone: 0.4550–0.4660
Stop Loss: 0.4230
TP1: 0.4814
TP2: 0.5104
TP3: 0.5394
Market Structure Analysis
BR is showing an interesting recovery pattern after completing a major correction from the 0.5329 swing high. The 1H chart reveals a broad rounded-bottom formation, suggesting that buyers have gradually regained strength after the earlier selling pressure.
The market previously established a significant low around 0.4010 before recovering toward the upper resistance region. Since then, price has formed several reaction points, creating a developing recovery structure.
Currently trading near 0.4615, BR is approaching an important resistance zone around 0.4680–0.4750. This area has already produced multiple reactions, making it a critical level for determining the next directional move.
Resistance Breakout Potential
A sustained breakout above the purple resistance zone could confirm the completion of the rounded recovery pattern.
The first upside objective stands at 0.4814. If buyers maintain momentum above this level, the next resistance targets become 0.5104 and 0.5394.
The final target near 0.5394 represents an opportunity to revisit and potentially exceed the previous swing high of 0.5329.
Support and Volume Analysis
The lower demand region around 0.4010–0.4100 remains an important structural support area. Meanwhile, the recent price reactions around 0.4230 suggest an intermediate level that traders should monitor.
Volume expansion during the latest upward movement indicates renewed market participation. However, sustained buying volume will be important to confirm a genuine breakout rather than another temporary rejection.
Trading Strategy
The preferred approach is to monitor the 0.4680–0.4750 resistance zone for a convincing hourly breakout and successful retest.
A confirmed move above resistance could strengthen the bullish outlook and open the path toward the three projected upside targets.
Long Setup
Entry Zone: 0.4550–0.4660
Stop Loss: 0.4230
TP1: 0.4814
TP2: 0.5104
TP3: 0.5394
Market Structure Analysis
BR is showing an interesting recovery pattern after completing a major correction from the 0.5329 swing high. The 1H chart reveals a broad rounded-bottom formation, suggesting that buyers have gradually regained strength after the earlier selling pressure.
The market previously established a significant low around 0.4010 before recovering toward the upper resistance region. Since then, price has formed several reaction points, creating a developing recovery structure.
Currently trading near 0.4615, BR is approaching an important resistance zone around 0.4680–0.4750. This area has already produced multiple reactions, making it a critical level for determining the next directional move.
Resistance Breakout Potential
A sustained breakout above the purple resistance zone could confirm the completion of the rounded recovery pattern.
The first upside objective stands at 0.4814. If buyers maintain momentum above this level, the next resistance targets become 0.5104 and 0.5394.
The final target near 0.5394 represents an opportunity to revisit and potentially exceed the previous swing high of 0.5329.
Support and Volume Analysis
The lower demand region around 0.4010–0.4100 remains an important structural support area. Meanwhile, the recent price reactions around 0.4230 suggest an intermediate level that traders should monitor.
Volume expansion during the latest upward movement indicates renewed market participation. However, sustained buying volume will be important to confirm a genuine breakout rather than another temporary rejection.
Trading Strategy
The preferred approach is to monitor the 0.4680–0.4750 resistance zone for a convincing hourly breakout and successful retest.
A confirmed move above resistance could strengthen the bullish outlook and open the path toward the three projected upside targets.