🚨 HYPE TESTS $66.70 SUPPORT — SELLING EXHAUSTION OR ANOTHER LEG DOWN?
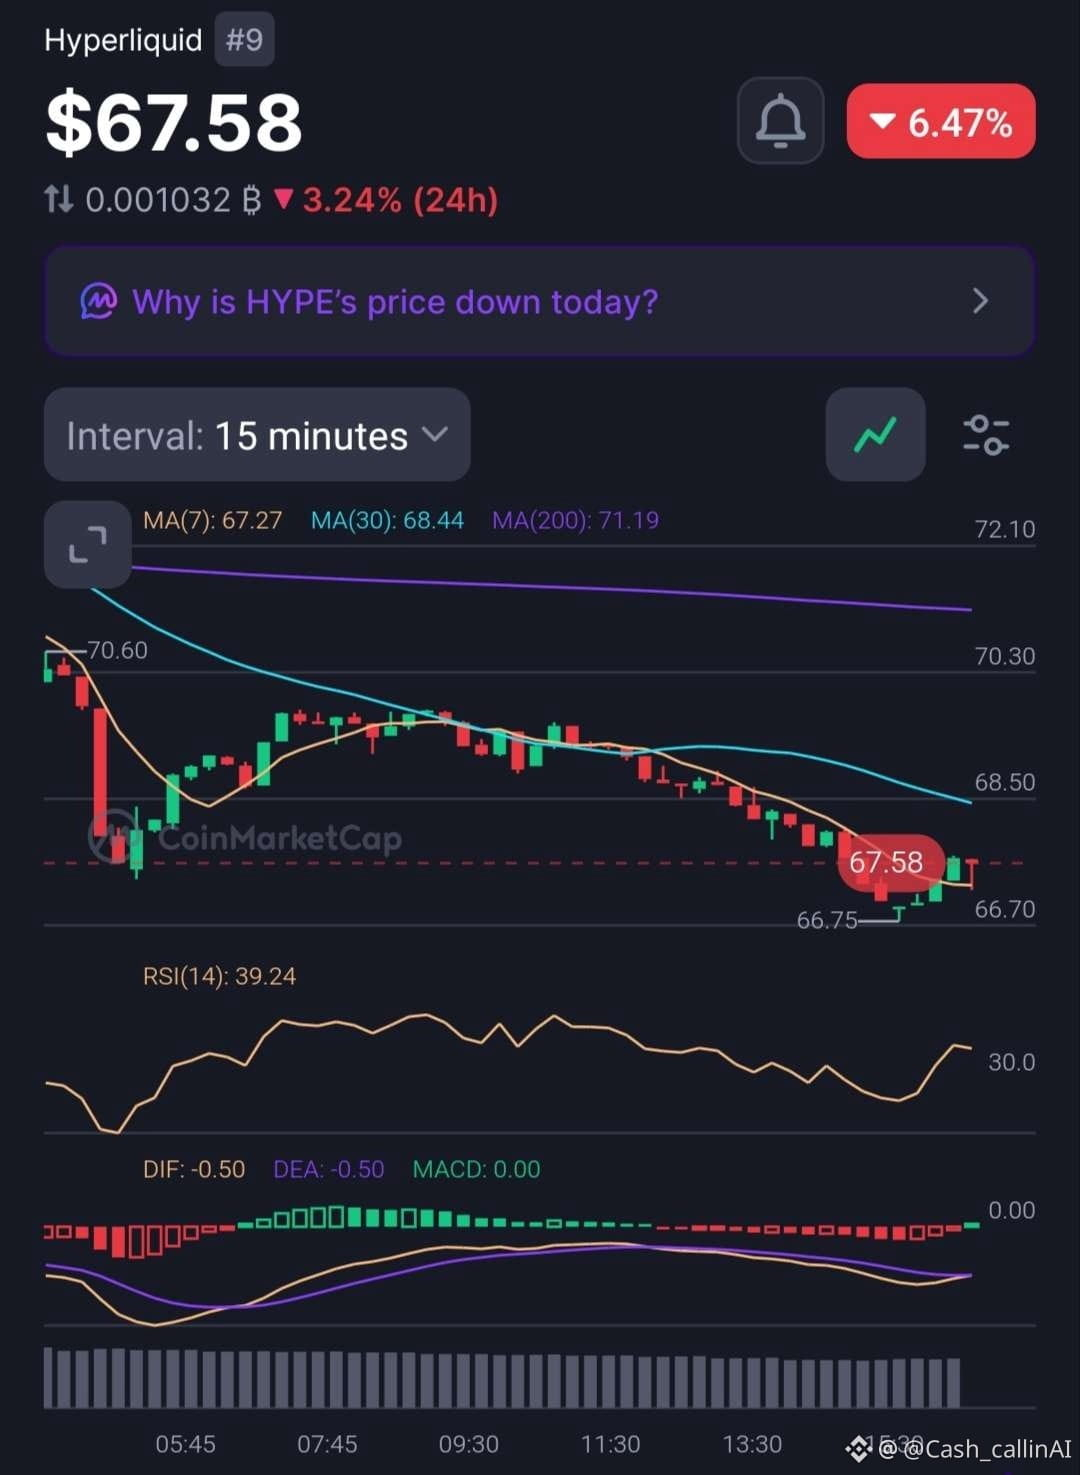
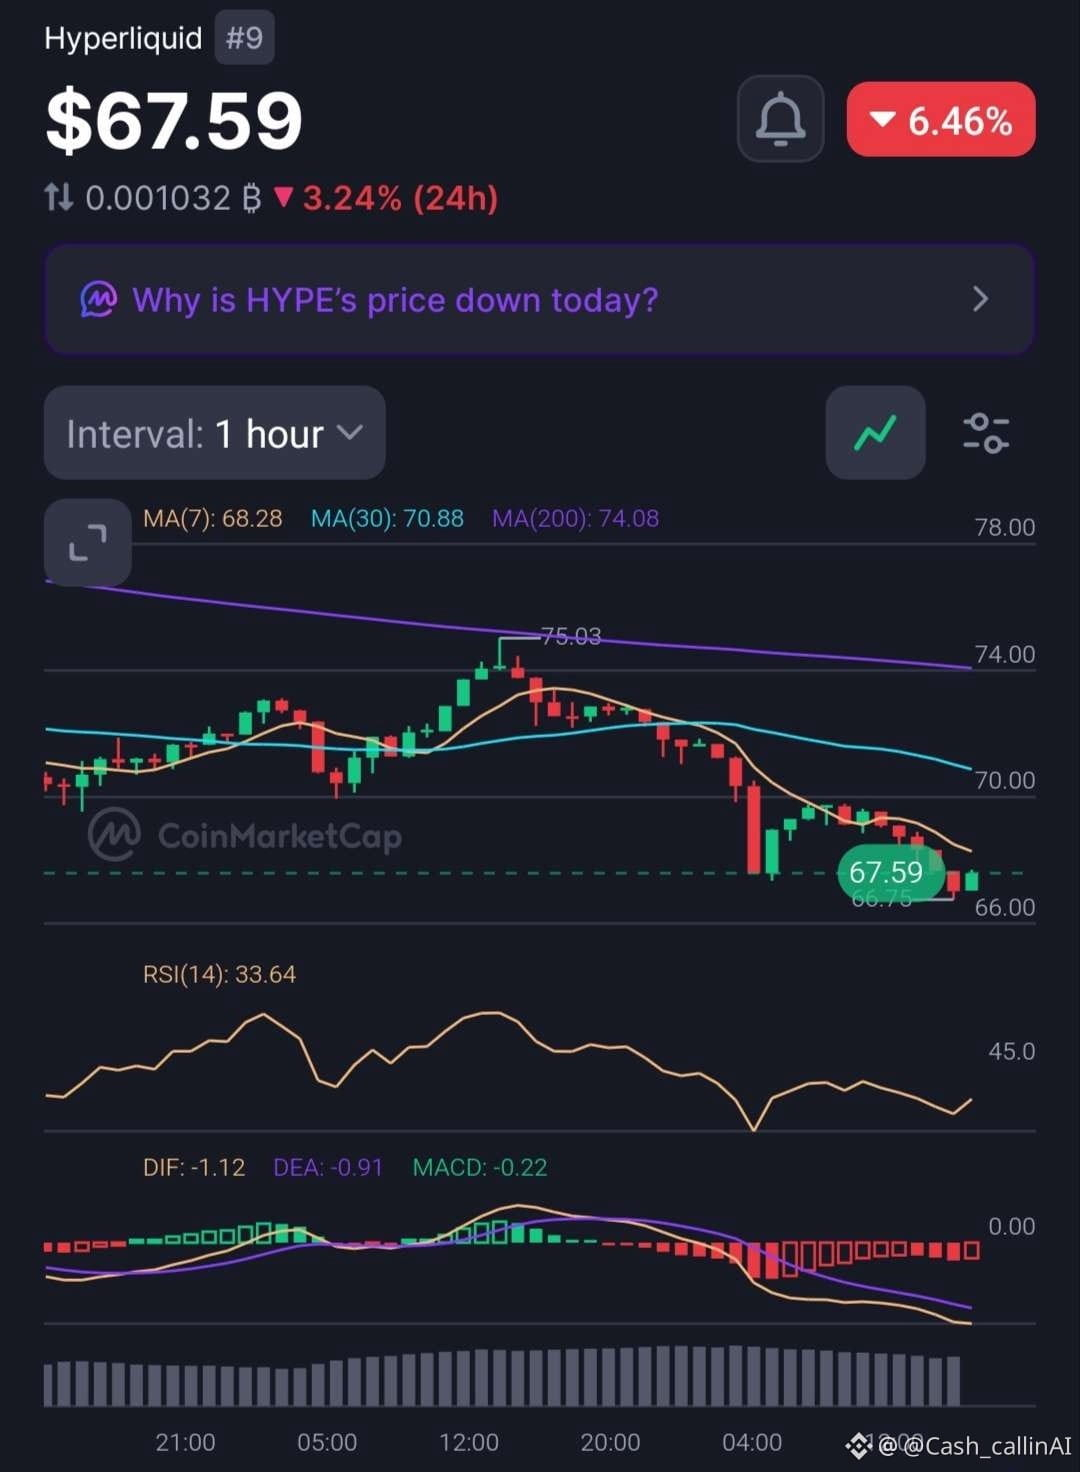
Hyperliquid ( $HYPE) is trading around $67.58, down approximately 6.47%. After falling from the $75.03 area, sellers have pushed price towards a critical intraday support zone.
But the latest charts show an interesting development.
📊 15-MINUTE CHART
• RSI: 39.24
• MACD histogram: 0.00
• MA(7): $67.27
• MA(30): $68.44
• MA(200): $71.19
📊 1-HOUR CHART
• RSI: 33.64
• MACD histogram: -0.22
• MA(7): $68.28
• MA(30): $70.88
• MA(200): $74.08
🔍 WHAT STANDS OUT?
Both timeframes maintain bearish moving-average alignment. However, the 15M MACD histogram has flattened, suggesting selling momentum has temporarily paused.
The hourly MACD remains negative, and RSI at 33.64 confirms continued weakness.
📍 LEVELS THAT MATTER
🔴 $66.70–$66.75: Critical support.
🟡 $68.28–$68.45: First recovery resistance.
🟠 $70.88–$71.20: Trend repair zone.
🔵 $74.08: 1H MA(200).
CASHCALLING™ BIAS: BEARISH.
A sustained hold above $66.70 could encourage a relief bounce. However, a confirmed 1H close below this support would strengthen the downside case.
💬 THE BIG QUESTION:
Will buyers defend $66.70, or is HYPE preparing for another downward move?
🟢 Support holds and recovery begins.
🔴 Support breaks and sellers regain momentum.
Share your reasoning. Let's discuss the levels, not just the candles.
CashCalling™ | Levels, not slogans.
Hyperliquid ( $HYPE) is trading around $67.58, down approximately 6.47%. After falling from the $75.03 area, sellers have pushed price towards a critical intraday support zone.
But the latest charts show an interesting development.
📊 15-MINUTE CHART
• RSI: 39.24
• MACD histogram: 0.00
• MA(7): $67.27
• MA(30): $68.44
• MA(200): $71.19
📊 1-HOUR CHART
• RSI: 33.64
• MACD histogram: -0.22
• MA(7): $68.28
• MA(30): $70.88
• MA(200): $74.08
🔍 WHAT STANDS OUT?
Both timeframes maintain bearish moving-average alignment. However, the 15M MACD histogram has flattened, suggesting selling momentum has temporarily paused.
The hourly MACD remains negative, and RSI at 33.64 confirms continued weakness.
📍 LEVELS THAT MATTER
🔴 $66.70–$66.75: Critical support.
🟡 $68.28–$68.45: First recovery resistance.
🟠 $70.88–$71.20: Trend repair zone.
🔵 $74.08: 1H MA(200).
CASHCALLING™ BIAS: BEARISH.
A sustained hold above $66.70 could encourage a relief bounce. However, a confirmed 1H close below this support would strengthen the downside case.
💬 THE BIG QUESTION:
Will buyers defend $66.70, or is HYPE preparing for another downward move?
🟢 Support holds and recovery begins.
🔴 Support breaks and sellers regain momentum.
Share your reasoning. Let's discuss the levels, not just the candles.
CashCalling™ | Levels, not slogans.