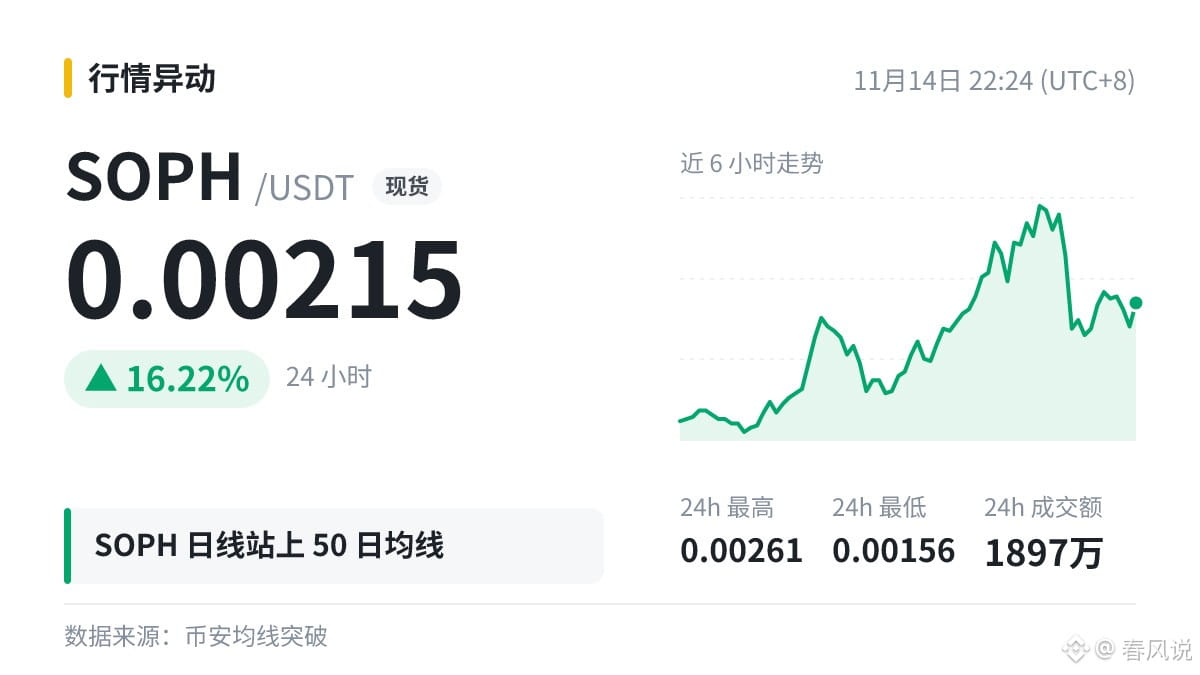
$SOPH The daily chart moved above MA50 (0.002381), with the current price at 0.00215.
MA50 reflects the medium-term trend, but the price has now fallen back below the moving average. For now, this is just a test; it only counts as holding above once several consecutive candlesticks close above the moving average.
What do you think?
Just jotting this down—make your own decisions about buying and selling.
MA50 reflects the medium-term trend, but the price has now fallen back below the moving average. For now, this is just a test; it only counts as holding above once several consecutive candlesticks close above the moving average.
What do you think?
Just jotting this down—make your own decisions about buying and selling.