Is a 47% pump with a 160% range actually a gift — or a warning? When a coin triples its daily range in one candle, the chart stops being about upside and starts being about who gets to keep the gains.
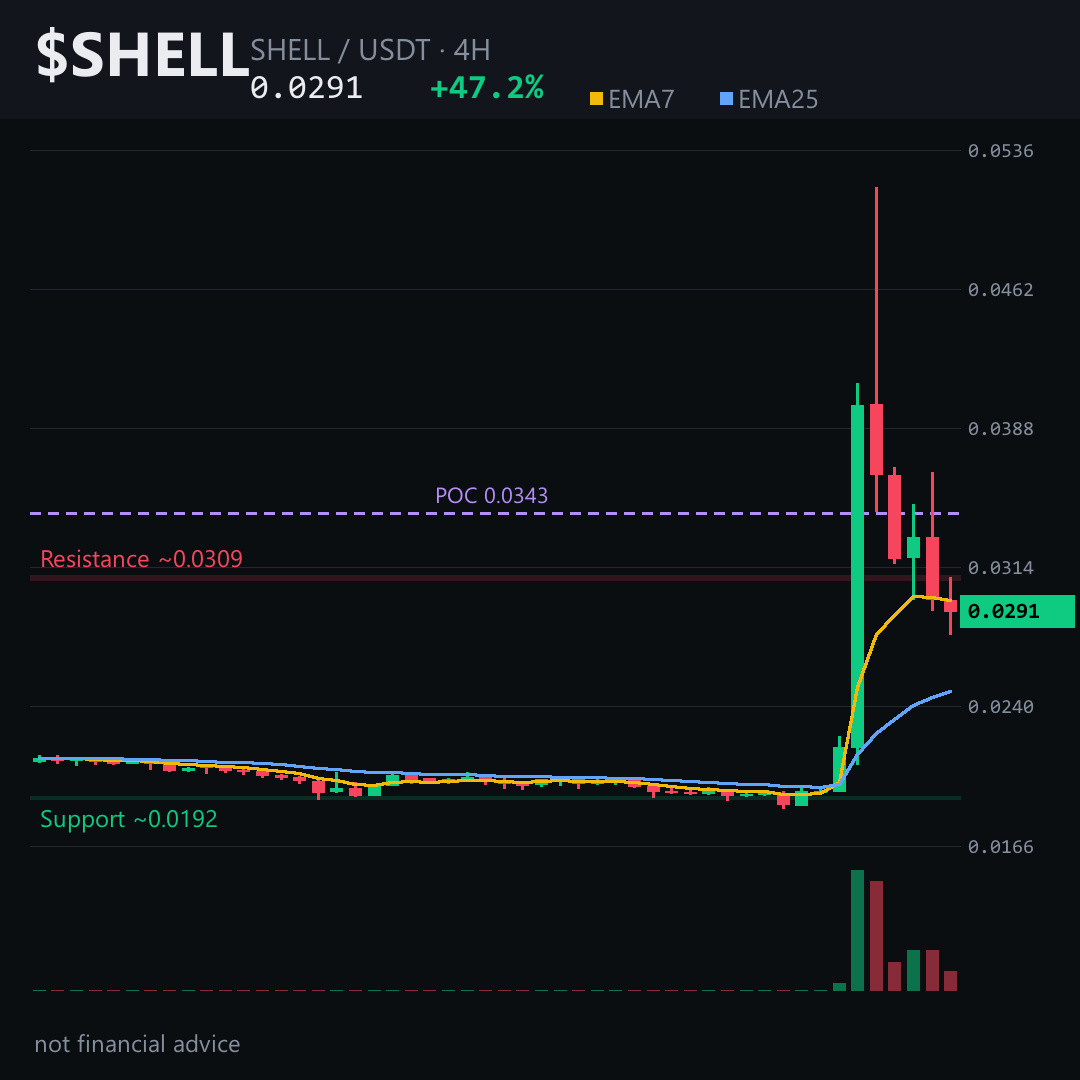
$SHELL just printed an 83% single 4H candle, slammed into 0.051, and has been giving roughly half of it back ever since.
The slower 4H averages are still sloped up, fast above slow. But RSI is nowhere near overheated — this pullback isn't exhaustion. It's the market deciding whether the big candle was real demand or a one-off spike.
Futures add a wrinkle. Funding is slightly negative — shorts are paying to hold. Open interest is large. Price fading while shorts pay to stay short can get sticky, but also leaves room for sharp bounces if those positions get uncomfortable.
The 4H chart is the one to read right now. 0.0277 is the line that matters: that's where the most recent push began. Losing it on a 4H close tells me the pump has fully unwound. Above that, 0.0317–0.0333 is the logical revisit zone if buyers step back in.
My read: the weekly picture is still heavy. This is a bounce inside a bigger downtrend until the daily chart proves otherwise. The real risk isn't the dip — it's treating a one-day outlier as a new regime.
I'll be watching whether the 4H holds 0.0277 or starts building lower highs — follow along if you want that update as the structure shifts.
What level are you watching on $SHELL right now? 👇
⚠️ Not financial advice. DYOR.
#SHELL #Crypto #BinanceSquare #TopGainer
$SHELL just printed an 83% single 4H candle, slammed into 0.051, and has been giving roughly half of it back ever since.
The slower 4H averages are still sloped up, fast above slow. But RSI is nowhere near overheated — this pullback isn't exhaustion. It's the market deciding whether the big candle was real demand or a one-off spike.
Futures add a wrinkle. Funding is slightly negative — shorts are paying to hold. Open interest is large. Price fading while shorts pay to stay short can get sticky, but also leaves room for sharp bounces if those positions get uncomfortable.
The 4H chart is the one to read right now. 0.0277 is the line that matters: that's where the most recent push began. Losing it on a 4H close tells me the pump has fully unwound. Above that, 0.0317–0.0333 is the logical revisit zone if buyers step back in.
My read: the weekly picture is still heavy. This is a bounce inside a bigger downtrend until the daily chart proves otherwise. The real risk isn't the dip — it's treating a one-day outlier as a new regime.
I'll be watching whether the 4H holds 0.0277 or starts building lower highs — follow along if you want that update as the structure shifts.
What level are you watching on $SHELL right now? 👇
⚠️ Not financial advice. DYOR.
#SHELL #Crypto #BinanceSquare #TopGainer