🚨 $BTC DEEP BREAKDOWN AND TEST OF 66,700 USD: CRITICAL SUPPORT SWEEP OR BEARISH CONTINUATION?
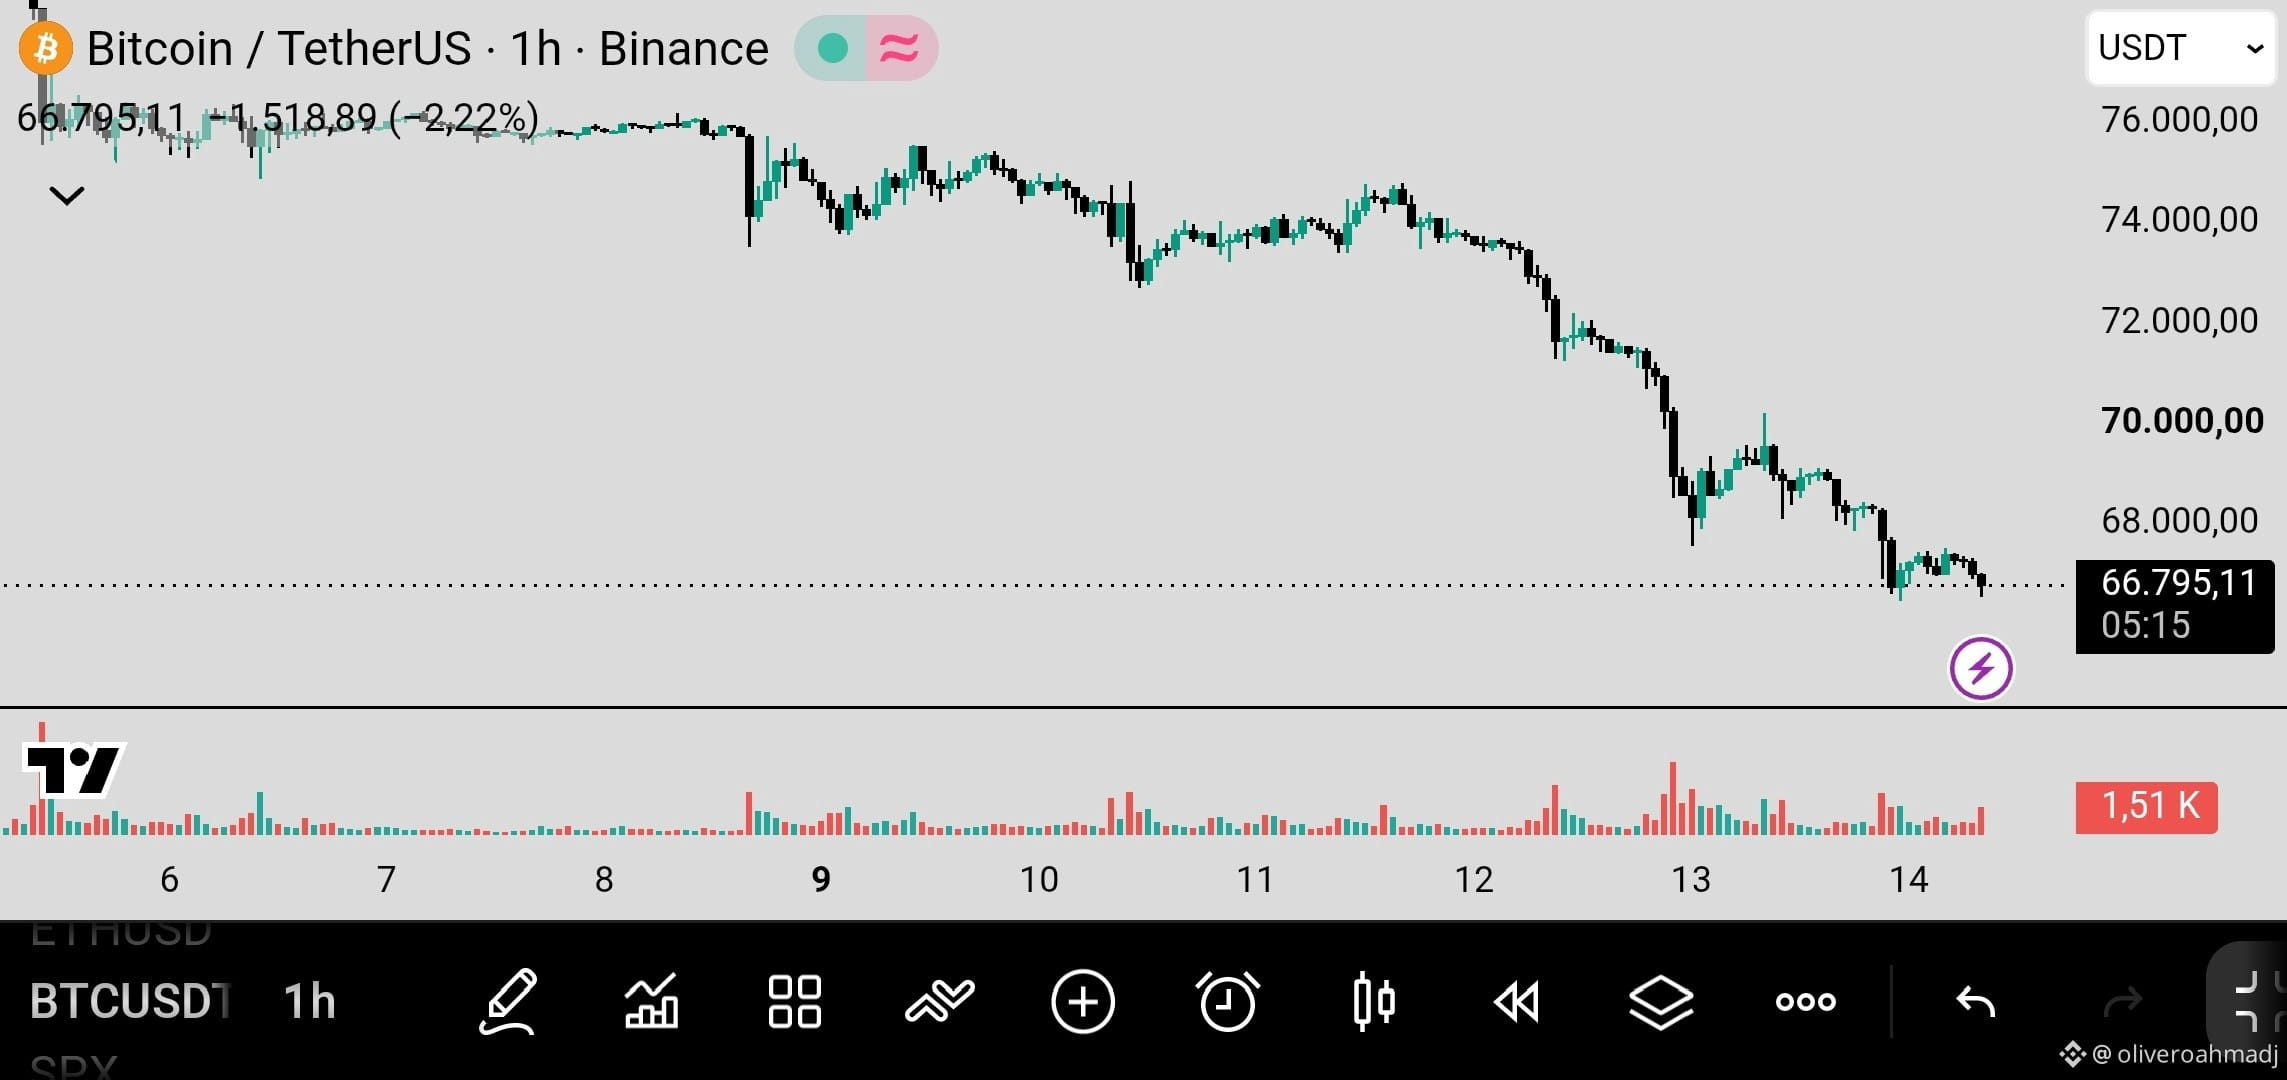
Price Movement: Amid marked selling pressure that has broken through multiple previous barriers, Bitcoin is experiencing a sharp decline and is trading around 66.795,11 USDT on the 1-hour chart, down -2,22%
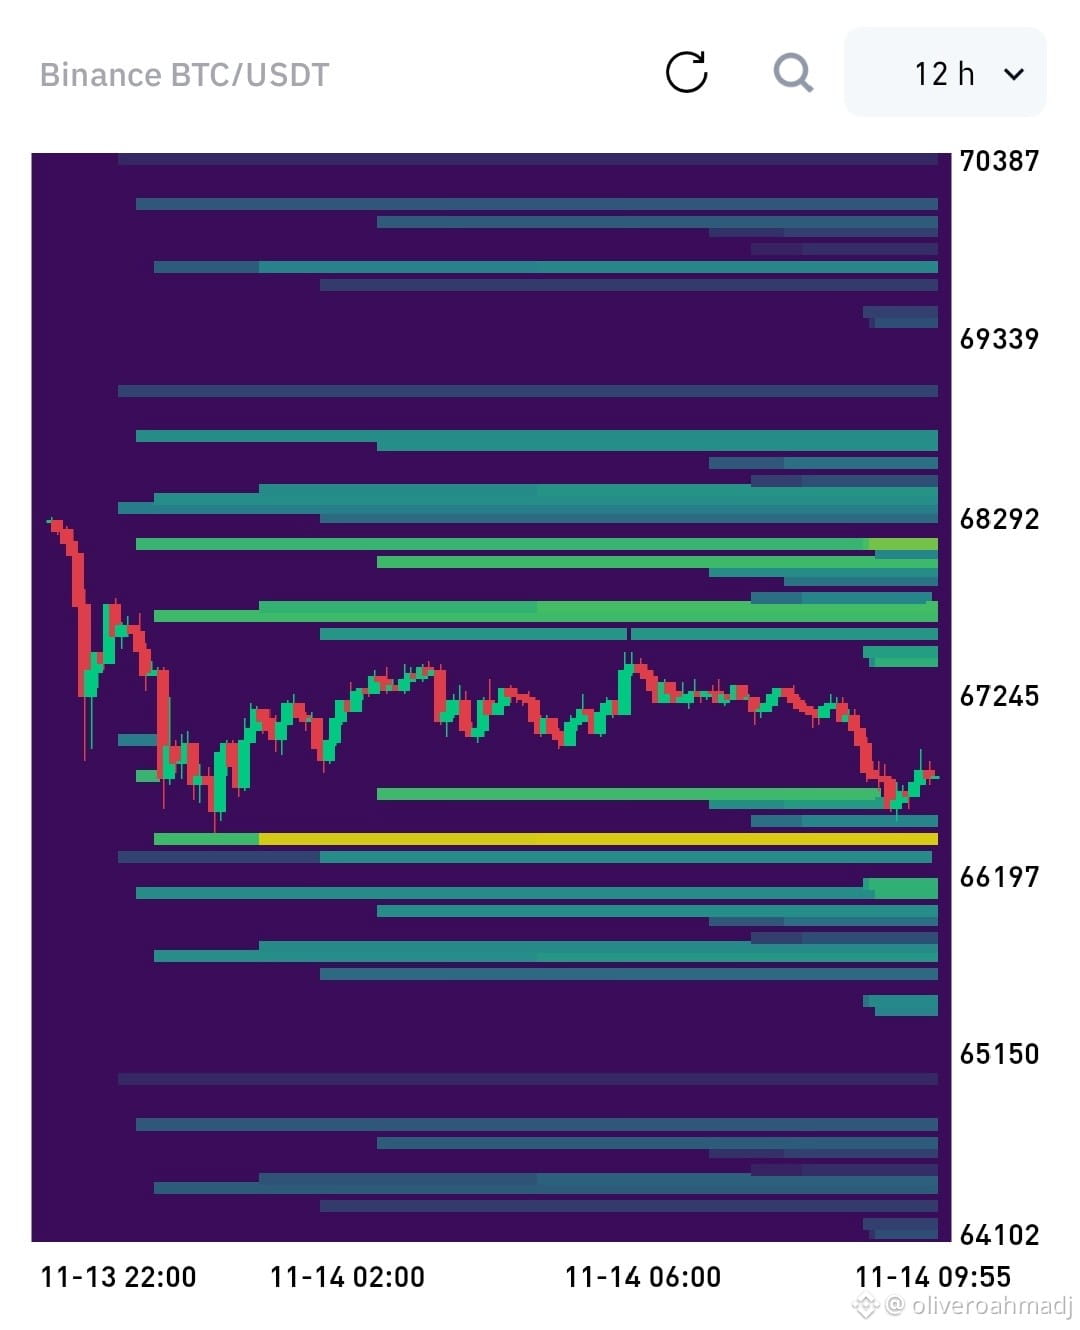
Upper Resistance Magnet: The 12-hour Liq Heatmap shows that selling liquidity has shifted massively toward the 68.292 USD range, making it the key immediate resistance to reclaim in order to curb the bearish momentum
Support and Lower Defense: On the downside, the densest liquidation blocks are firmly clustered around 66.197 USD (extending toward 65.150 USD), serving as the most critical technical support cushion to watch
Market Dynamics: Price action reflects a sustained increase in trading volume during bearish candles, indicating heavy liquidation of leveraged positions and high volatility in the order books
Do you think support at 66.200 USD will hold the price and allow it to stabilize, or will we see a direct sweep toward the 65.000 USD zone? Let us know in the comments! 👇
🔎 Monitor order book depth and real-time flow changes on the official BTC/USDT pair
#Bitcoin #BTC #Crypto #Trading #BTCUSDT
Price Movement: Amid marked selling pressure that has broken through multiple previous barriers, Bitcoin is experiencing a sharp decline and is trading around 66.795,11 USDT on the 1-hour chart, down -2,22%
Upper Resistance Magnet: The 12-hour Liq Heatmap shows that selling liquidity has shifted massively toward the 68.292 USD range, making it the key immediate resistance to reclaim in order to curb the bearish momentum
Support and Lower Defense: On the downside, the densest liquidation blocks are firmly clustered around 66.197 USD (extending toward 65.150 USD), serving as the most critical technical support cushion to watch
Market Dynamics: Price action reflects a sustained increase in trading volume during bearish candles, indicating heavy liquidation of leveraged positions and high volatility in the order books
Do you think support at 66.200 USD will hold the price and allow it to stabilize, or will we see a direct sweep toward the 65.000 USD zone? Let us know in the comments! 👇
🔎 Monitor order book depth and real-time flow changes on the official BTC/USDT pair
#Bitcoin #BTC #Crypto #Trading #BTCUSDT