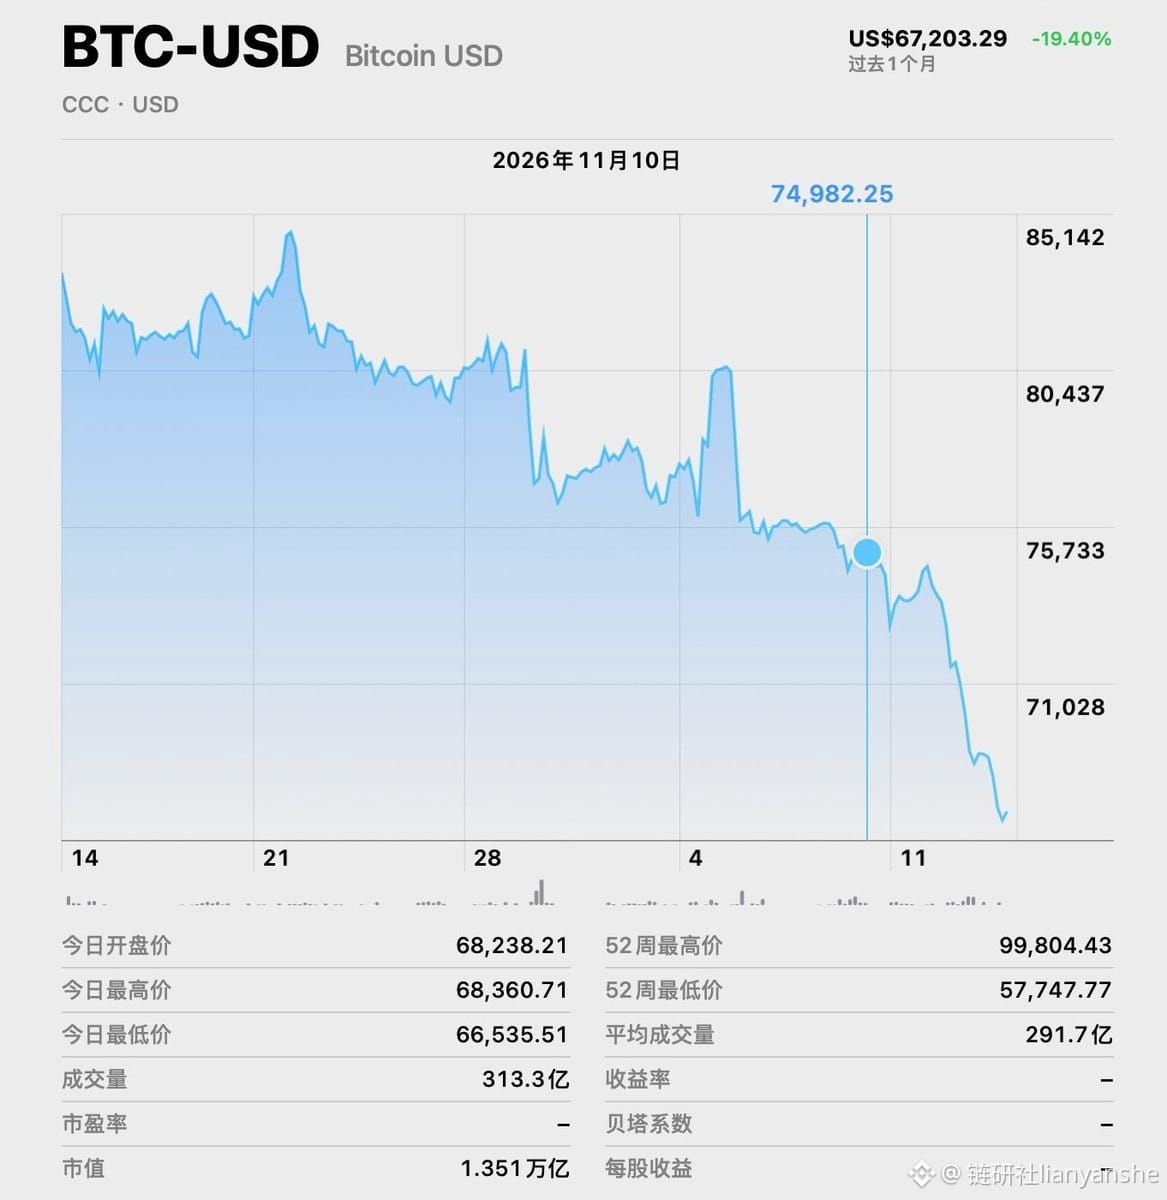
I reviewed with a friend today why this drop was so much worse than expected. Looking back, Bitcoin $BTC had already started weakening noticeably after the hotter-than-expected core CPI report on November 10, when it plunged and broke through support.
The 75,500 level was also the MA120 and MicroStrategy’s $MSTR average cost basis. After the CPI data came out, the price broke straight through the previous low and briefly dipped into the low 72,000s. Then the rebound was followed by one bearish development after another.
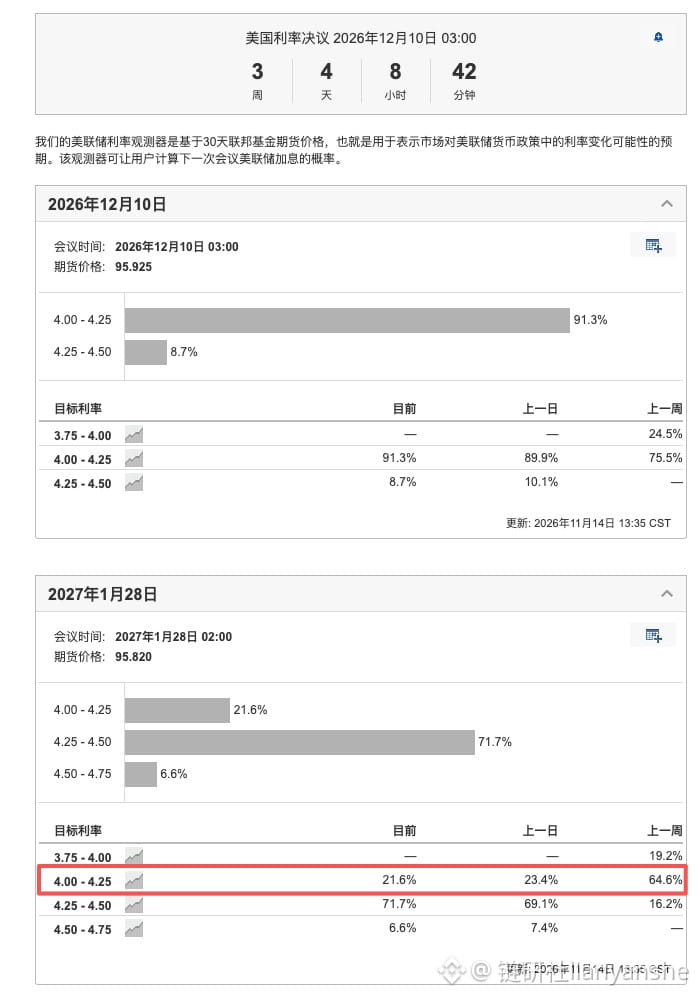
After the CPI report, the probability of a 25-basis-point hike in January rose from 16% to nearly 70%. The market had previously priced in only a 25-basis-point hike in December; a January hike hadn’t been priced in. It also makes perfect sense that Bitcoin is especially sensitive to monetary cycles.
We also talked about what’s different about this cycle.
The first three cycles each took about a year to go from peak to bottom:
The peak was around 1,150 in November 2013, and the bottom was around 152 in January 2015—a drop of 86% over about 13 months.
The peak was around 19,700 in December 2017, and the bottom was around 3,200 in December 2018—a drop of 84% over about 12 months.
The peak was around 69,000 in November 2021, and the bottom was 15,476 in November 2022—a drop of 77% over about 12.5 months.
Looking at the halving cycles, the previous bottoms all came roughly 17 to 18 months before the next halving. The next halving is expected around April 2028, which would put the bottom around the end of 2026.
This cycle’s peak was 126,200 on October 6, 2025. Based on a 12-to-13-month timeline, the bottom should come between October and November 2026. The price of 57,800 was reached on July 1, just 9 months after the peak—a 54% drop, much shallower than the 77% to 86% drops in previous cycles.
We all think this sharp drop will find a bottom soon, but exactly where is still uncertain. In terms of timing, it could happen within the next week, and we should see it by the end of November at the latest. We’re leaning toward the 60,000–63,000 area, where the price could hold above the previous low and sit near mining costs.
So there are two possible scenarios: the first has a 70% probability, and the second a 30% probability.
The first is that this cycle is shorter and shallower, with ETF and institutional money dampening volatility. The 57,800 low in July was the bear-market bottom, and the bull market began in July. This time, the drop of more than 20% from the high is similar to the Silicon Valley Bank black-swan event in 2023, and the price won’t make a new low.
The second is that the cycle follows historical patterns closely, with the true bottom still forming somewhere in the October-to-December window. The current pullback from 66,614 may itself be part of the bottoming process. The dividing line between the two interpretations is 57,800: if it holds, the first scenario is confirmed; if it breaks, we follow the second, and the bottom is still lower.
The 75,500 level was also the MA120 and MicroStrategy’s $MSTR average cost basis. After the CPI data came out, the price broke straight through the previous low and briefly dipped into the low 72,000s. Then the rebound was followed by one bearish development after another.
After the CPI report, the probability of a 25-basis-point hike in January rose from 16% to nearly 70%. The market had previously priced in only a 25-basis-point hike in December; a January hike hadn’t been priced in. It also makes perfect sense that Bitcoin is especially sensitive to monetary cycles.
We also talked about what’s different about this cycle.
The first three cycles each took about a year to go from peak to bottom:
The peak was around 1,150 in November 2013, and the bottom was around 152 in January 2015—a drop of 86% over about 13 months.
The peak was around 19,700 in December 2017, and the bottom was around 3,200 in December 2018—a drop of 84% over about 12 months.
The peak was around 69,000 in November 2021, and the bottom was 15,476 in November 2022—a drop of 77% over about 12.5 months.
Looking at the halving cycles, the previous bottoms all came roughly 17 to 18 months before the next halving. The next halving is expected around April 2028, which would put the bottom around the end of 2026.
This cycle’s peak was 126,200 on October 6, 2025. Based on a 12-to-13-month timeline, the bottom should come between October and November 2026. The price of 57,800 was reached on July 1, just 9 months after the peak—a 54% drop, much shallower than the 77% to 86% drops in previous cycles.
We all think this sharp drop will find a bottom soon, but exactly where is still uncertain. In terms of timing, it could happen within the next week, and we should see it by the end of November at the latest. We’re leaning toward the 60,000–63,000 area, where the price could hold above the previous low and sit near mining costs.
So there are two possible scenarios: the first has a 70% probability, and the second a 30% probability.
The first is that this cycle is shorter and shallower, with ETF and institutional money dampening volatility. The 57,800 low in July was the bear-market bottom, and the bull market began in July. This time, the drop of more than 20% from the high is similar to the Silicon Valley Bank black-swan event in 2023, and the price won’t make a new low.
The second is that the cycle follows historical patterns closely, with the true bottom still forming somewhere in the October-to-December window. The current pullback from 66,614 may itself be part of the bottoming process. The dividing line between the two interpretations is 57,800: if it holds, the first scenario is confirmed; if it breaks, we follow the second, and the bottom is still lower.