
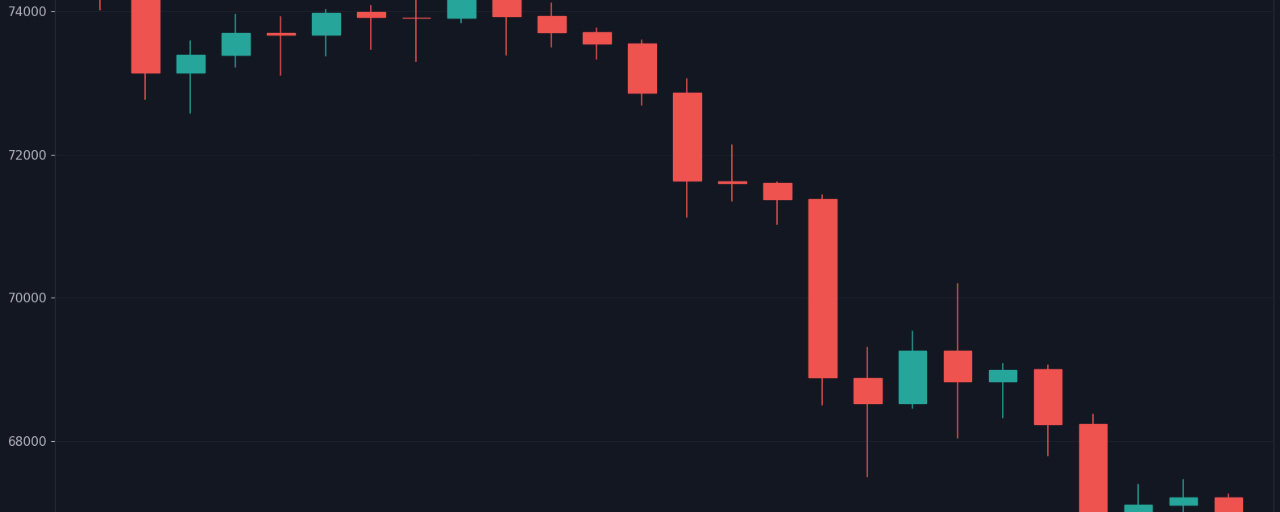

Have you ever opened a crypto chart, seen a row of green and red candles, then closed it right away because it made your head spin? But each candlestick tells the whole story of the tug-of-war between buyers and sellers over a period of time. It’s much easier to read than it looks, seriously.
**The Anatomy of a Candle, Step by Step**
A candlestick is a way to show price movements over a period of time, such as 1 hour or 1 day. Each candle contains four pieces of information: the opening price, closing price, highest price, and lowest price during that period.
The thick rectangular part is called the body. It shows the distance between the opening and closing prices. The thin lines extending above and below it are called wicks or shadows. The tip of the upper wick marks the highest price, while the tip of the lower wick marks the lowest price.
If a candle is green, it means the closing price was higher than the opening price—the buyers won during that period. If it’s red, the closing price was lower than the opening price, so sellers had the upper hand. That’s all you need to know for now; don’t jump straight into complicated patterns.
Here’s how to read one. A green candle with a long body means the price rose quite a bit from open to close—the buyers were really fired up. A candle with a long upper wick means the price climbed high for a while, but was pushed back down before closing. Someone was selling up there, making the story a bit more interesting.
**What to Pay Attention to First**
- The candle’s color shows who won between the open and close
- A long body shows a strong push in one direction
- A long wick shows price rejection at a certain level
- One candle on its own isn’t enough; look at the candles before and after it
But hold on—don’t assume that one green candle means the price will definitely keep going up. A candle is a snapshot of one scene, not the end of the movie. Beginners often get fooled by reading a single candle like a prophecy. But the market loves to play tricks; the next candle can suddenly turn the story around.
The key is context. The same candle can mean different things depending on where it appears on the chart. So get into the habit of zooming out before drawing any conclusions.
The point is, don’t start by memorizing candle patterns. Read the story instead: who’s pushing, who’s holding back, and who ultimately wins.
Looking at the candle anatomy we just covered, which part is newer to you: the body or the wick?
This content is for educational purposes, not investment advice. Always do your own research (DYOR).
#Candlestick #TechnicalAnalysis #LearnCrypto #Trading
$BTC$ETH$BNB