SOL at $76—are your hands shaking?
The daily RSI has fallen to 17—the kind of reading last seen during the 2022 FTX collapse. Down another 6% in 24 hours, 16% in 7 days, and a quarter of its value in 30 days. How much further can SOL fall?
First, the surface picture: bears are firmly in control, with no sign of resistance.
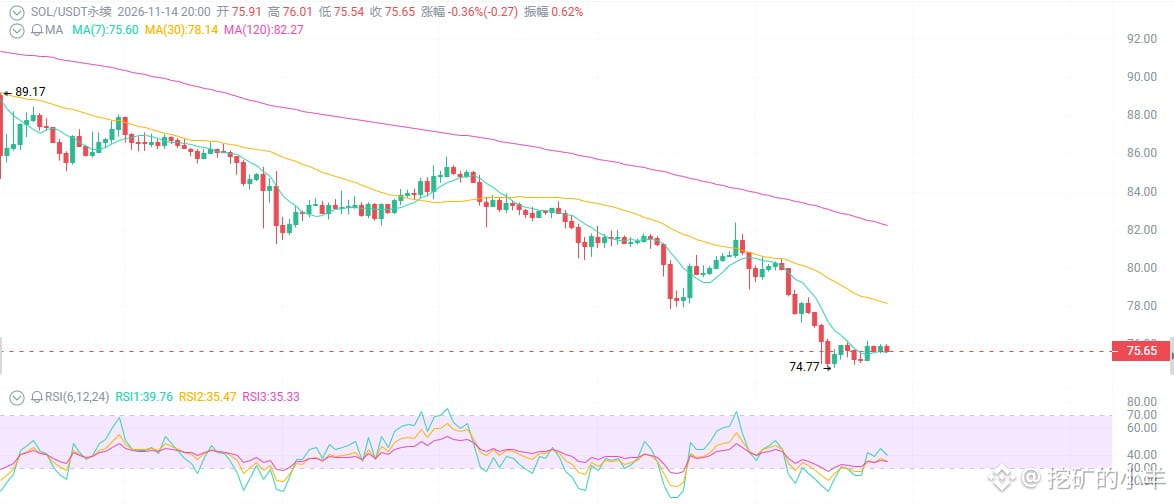
The price has plunged from its ATH of 293 to 76, a 74% drawdown. The daily chart shows consecutive lower highs and lower lows, with the price below the 20-, 50-, and 200-day moving averages—a textbook descending channel. Trading volume surged to around 3 billion as prices fell. Retail traders alone couldn’t generate that kind of volume; it’s the bloodbath of leveraged longs being liquidated one after another.
First things first: this sell-off has absolutely nothing to do with SOL itself.
The real culprit is October’s CPI. The data came in hot, with core CPI month over month exceeding expectations. The market immediately priced in the odds of a December rate hike to the max—starting at 25 bps, with some even betting on 50 bps. Risk assets across the board took a hit, BTC pulled back too, and SOL simply fell harder because it has a higher beta: it rises faster when markets are up and falls harder when they’re down.
What hurts even more is that ETFs have seen net outflows for several consecutive days, with millions to tens of millions of dollars flowing out each day.
Second: the fundamentals, however, haven’t deteriorated at all.
DTCC plans to bring its Tokenization Service to Solana in the second half of 2027—this is Wall Street clearing infrastructure, not a minor project.
The Alpenglow consensus upgrade is live, with finality down to 150 milliseconds and shorter slot times.
RWA is worth around $5 billion, DEX trading is active, and the number of stablecoin-holding addresses is growing.
Samsung Wallet supports USDC, and payment use cases are becoming a reality.
TVL and stablecoin supply have fluctuated slightly, but remain at elevated levels overall. Developer activity and real-world use cases are still...
Third: technically, SOL is at an extreme “bounce or bust” level.
74.8–75.3 is the 24-hour low and the last line of defense in the short term. Below that comes 73–74, then 70–72—the round-number level and a key area from earlier.
RSI is at 17–28, deep in oversold territory. MACD is still bearish, but showing signs of flattening. The price is hugging the lower edge of the descending channel. Oversold conditions plus the channel’s lower boundary mean a technical bounce could happen at any time.
But an asset can become even more oversold. Oversold is not a reason to buy—stabilization is.
Resistance above: 76.5–78 → 80–82 → 86–90
Support below: 74.8–75.3 → 73–74 → 70–72
80 is the dividing line. Only once it holds above 80 can we talk about a reversal in the short-term structure. If it can’t hold, the 70–82 range will keep grinding on.
The daily RSI has fallen to 17—the kind of reading last seen during the 2022 FTX collapse. Down another 6% in 24 hours, 16% in 7 days, and a quarter of its value in 30 days. How much further can SOL fall?
First, the surface picture: bears are firmly in control, with no sign of resistance.
The price has plunged from its ATH of 293 to 76, a 74% drawdown. The daily chart shows consecutive lower highs and lower lows, with the price below the 20-, 50-, and 200-day moving averages—a textbook descending channel. Trading volume surged to around 3 billion as prices fell. Retail traders alone couldn’t generate that kind of volume; it’s the bloodbath of leveraged longs being liquidated one after another.
First things first: this sell-off has absolutely nothing to do with SOL itself.
The real culprit is October’s CPI. The data came in hot, with core CPI month over month exceeding expectations. The market immediately priced in the odds of a December rate hike to the max—starting at 25 bps, with some even betting on 50 bps. Risk assets across the board took a hit, BTC pulled back too, and SOL simply fell harder because it has a higher beta: it rises faster when markets are up and falls harder when they’re down.
What hurts even more is that ETFs have seen net outflows for several consecutive days, with millions to tens of millions of dollars flowing out each day.
Second: the fundamentals, however, haven’t deteriorated at all.
DTCC plans to bring its Tokenization Service to Solana in the second half of 2027—this is Wall Street clearing infrastructure, not a minor project.
The Alpenglow consensus upgrade is live, with finality down to 150 milliseconds and shorter slot times.
RWA is worth around $5 billion, DEX trading is active, and the number of stablecoin-holding addresses is growing.
Samsung Wallet supports USDC, and payment use cases are becoming a reality.
TVL and stablecoin supply have fluctuated slightly, but remain at elevated levels overall. Developer activity and real-world use cases are still...
Third: technically, SOL is at an extreme “bounce or bust” level.
74.8–75.3 is the 24-hour low and the last line of defense in the short term. Below that comes 73–74, then 70–72—the round-number level and a key area from earlier.
RSI is at 17–28, deep in oversold territory. MACD is still bearish, but showing signs of flattening. The price is hugging the lower edge of the descending channel. Oversold conditions plus the channel’s lower boundary mean a technical bounce could happen at any time.
But an asset can become even more oversold. Oversold is not a reason to buy—stabilization is.
Resistance above: 76.5–78 → 80–82 → 86–90
Support below: 74.8–75.3 → 73–74 → 70–72
80 is the dividing line. Only once it holds above 80 can we talk about a reversal in the short-term structure. If it can’t hold, the 70–82 range will keep grinding on.