Are we being too optimistic about $BTC ?
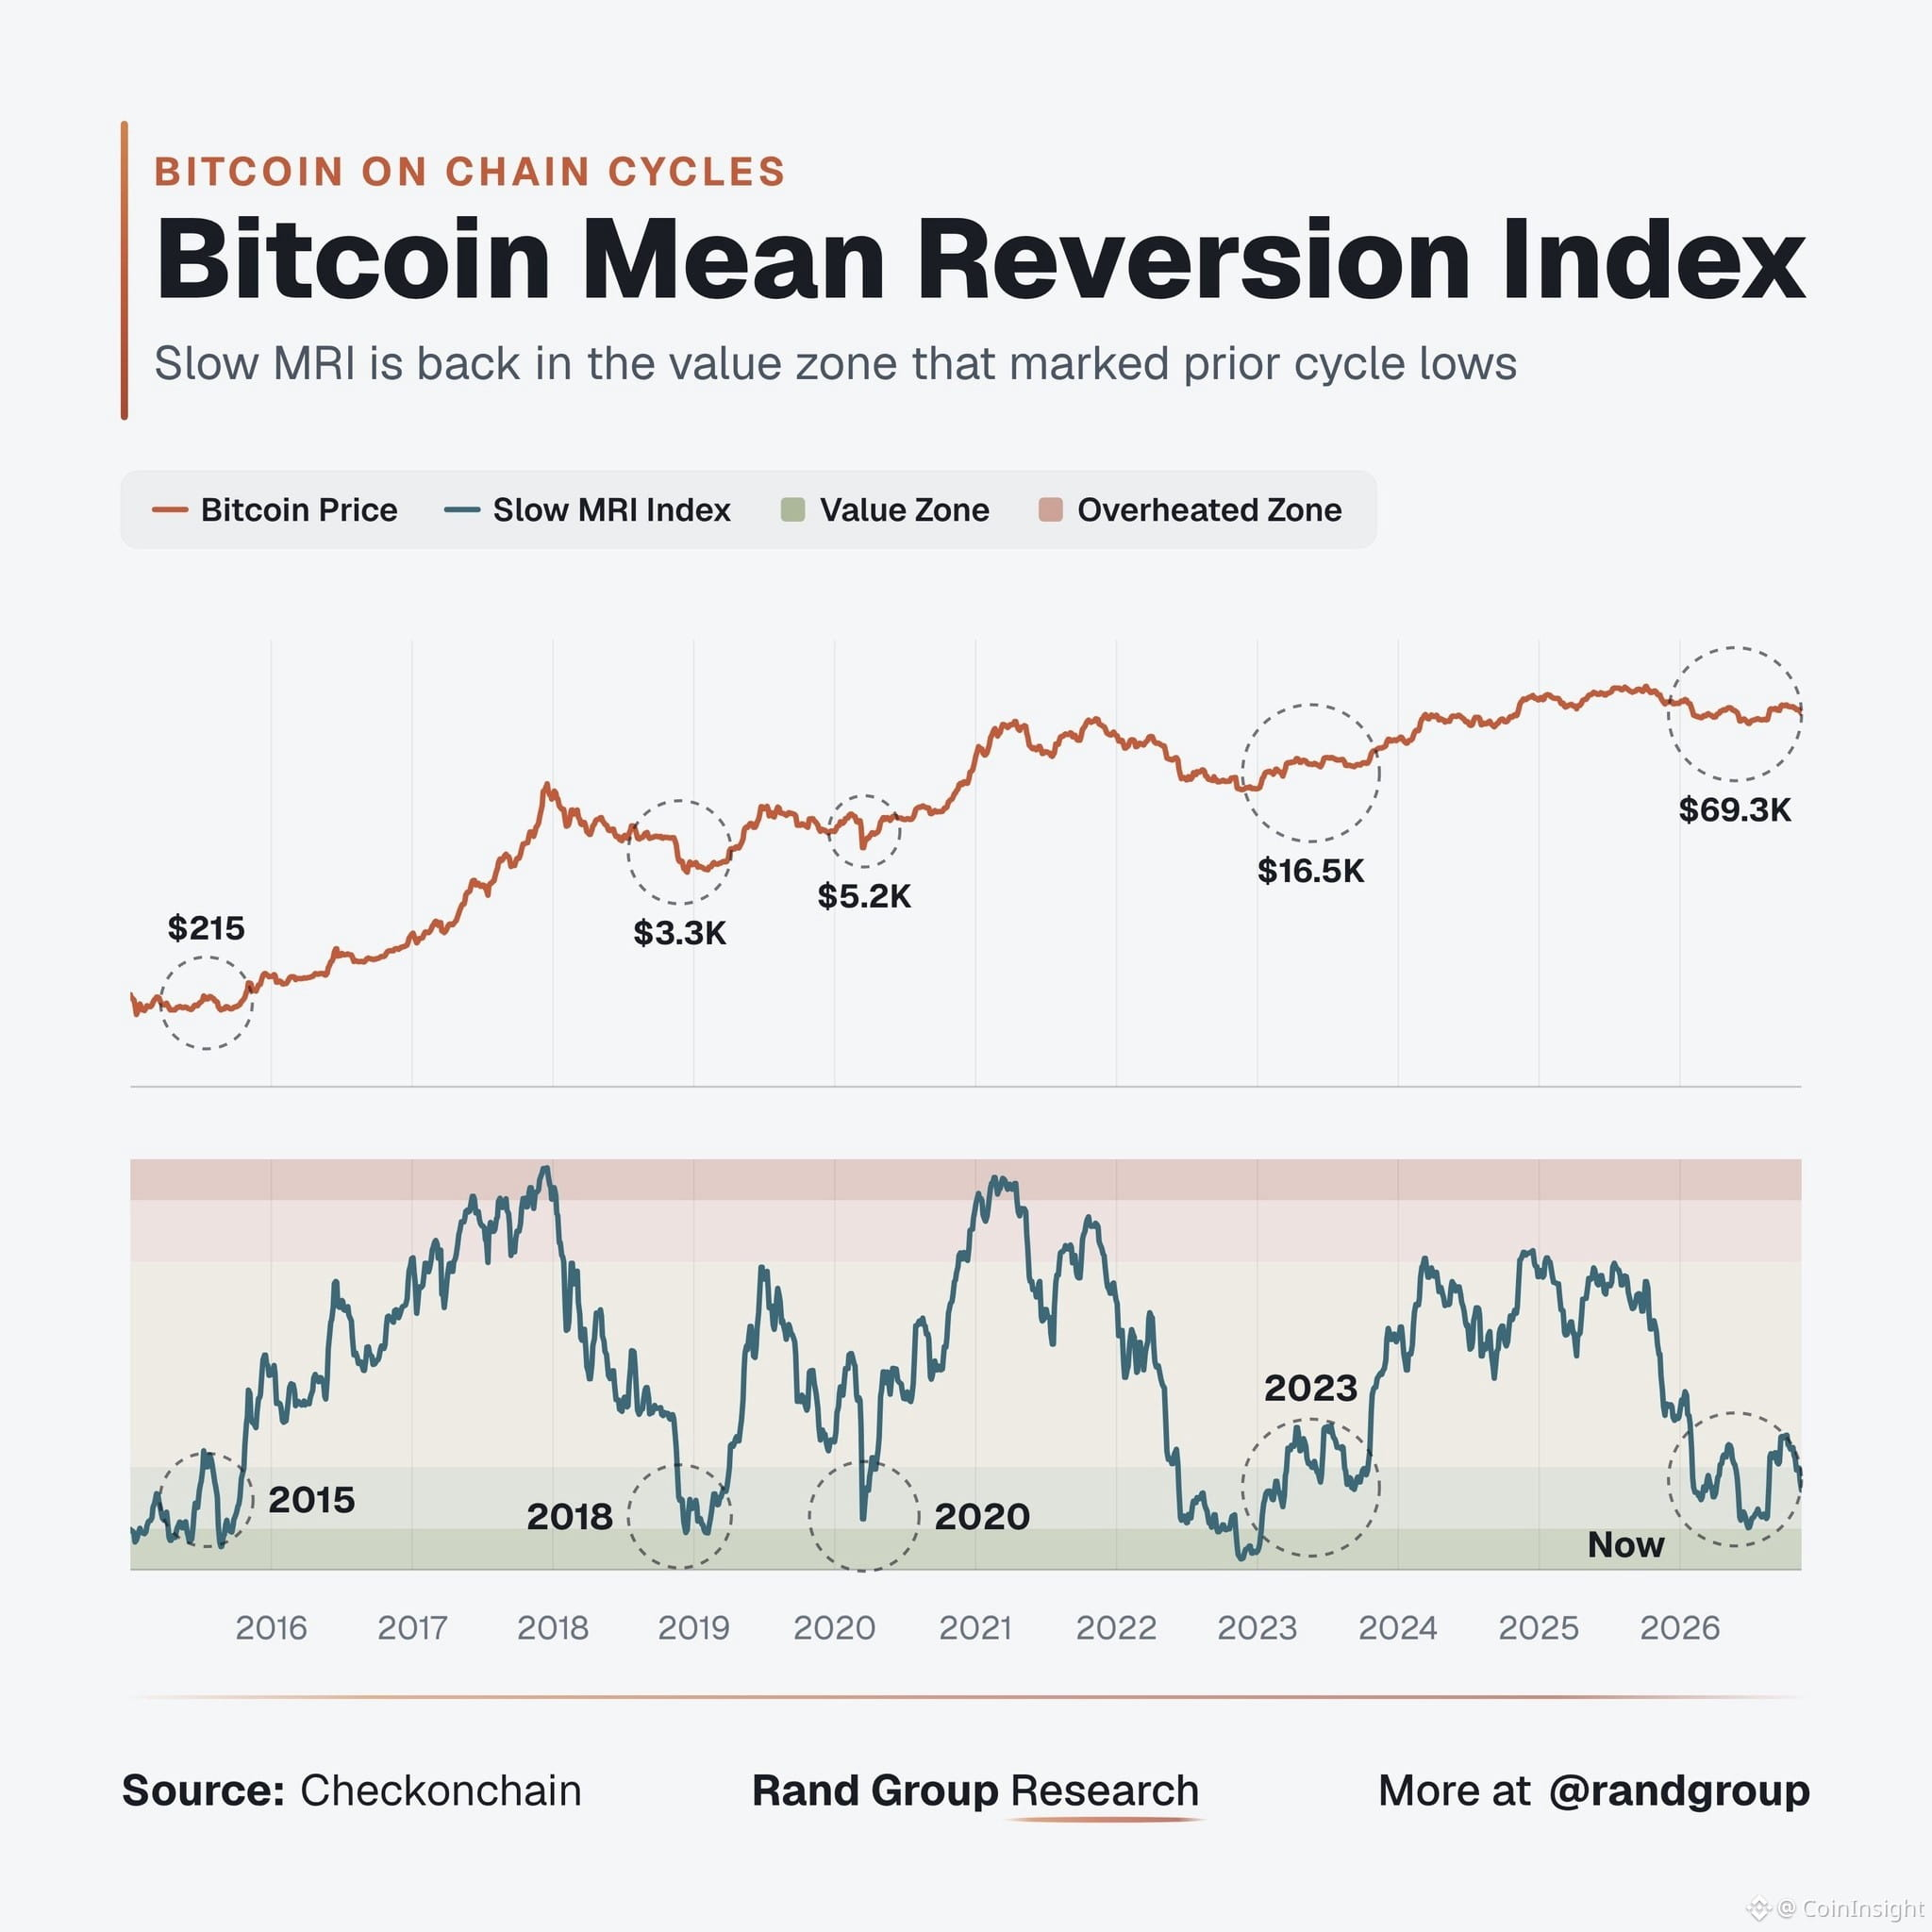
According to Rand Group Research, the Slow Mean Reversion indicator has returned to a historical price range where $BTC previously appeared at major bottoms.
Looking back:
- 2015: $BTC was at $215.
- 2018: $BTC was around $3.3K.
- 2020: $BTC dropped to $5.2K during the COVID shock.
- 2023: $BTC was around $16.5K after the 2022 bear market.
Currently, $BTC is at $69.3K, but is this a sign of an immediate recovery?
This indicator shows that $BTC is at a historically low price, but don't forget that selling pressure could persist.
Is this the time to accumulate, or is it just a liquidity trap? What do you think?
According to Rand Group Research, the Slow Mean Reversion indicator has returned to a historical price range where $BTC previously appeared at major bottoms.
Looking back:
- 2015: $BTC was at $215.
- 2018: $BTC was around $3.3K.
- 2020: $BTC dropped to $5.2K during the COVID shock.
- 2023: $BTC was around $16.5K after the 2022 bear market.
Currently, $BTC is at $69.3K, but is this a sign of an immediate recovery?
This indicator shows that $BTC is at a historically low price, but don't forget that selling pressure could persist.
Is this the time to accumulate, or is it just a liquidity trap? What do you think?