Bitcoin ($BTC
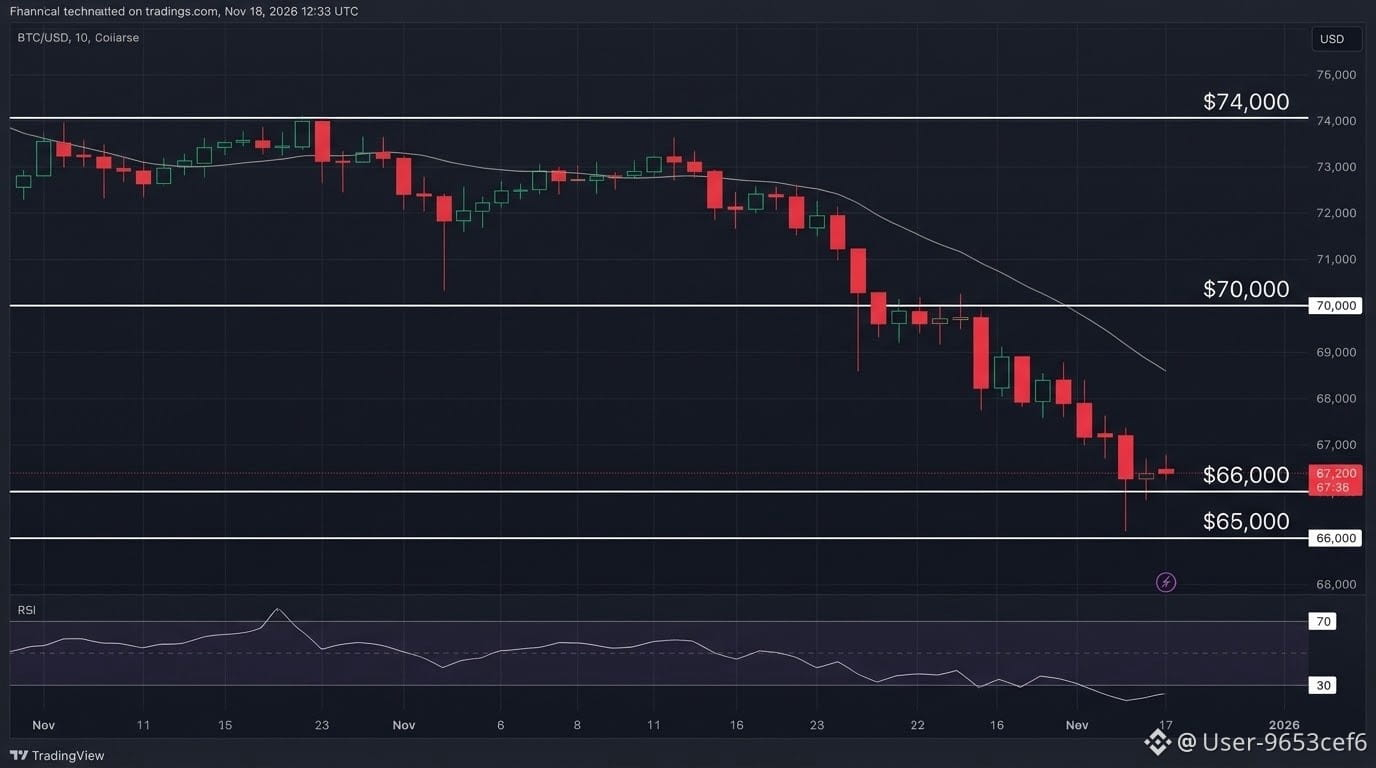
#WhatWillDriveCryptoandStocks’NextRebound? #USPPIMissMayEaseBTCPressure #TradFiForBeginners ) is experiencing a sharp corrective selloff, trading near $67,200 (approx. PKR 18.59 million) as of November 14, 2026. After failing to hold the psychological $70,000 threshold earlier this week, BTC has dropped over 10% since the start of November and is down roughly 23.8% year-to-date.
Technical Overview
Trend Structure: Short-term and daily market structures are decisively bearish. BTC broke down from a short-term bull flag and slipped below its 200-day simple moving average (around $73,200) and the $70,000 psychological support level.
Momentum (RSI): The daily Relative Strength Index (RSI) has dipped below 30, signaling strong downward momentum alongside oversold conditions that could trigger a short-term relief bounce.
Key Macro & Market Drivers
Hawkish Federal Reserve Expectations: Hotter-than-expected U.S. CPI inflation readings have revived expectations that the Fed may raise rates further or hold them higher for longer, pressuring zero-yielding assets like Bitcoin.
Institutional Outflows & Liquidations: U.S. spot Bitcoin ETFs recorded approximately $1.28 billion in weekly net outflows, accompanied by over $1 billion in leveraged long liquidations.
Regulatory & Equity Headwinds: Gridlock risks surrounding the U.S. CLARITY Act following the midterm elections and broader volatility in tech/AI equities have dampened institutional risk appetite.
Scenarios to Watch
Bearish Continuation: If buyers fail to defend the $66,000 floor on a daily close, selling pressure will likely test $65,000 and potentially expose the $60,000 demand zone.
Relief Bounce / Stabilization: Given oversold RSI readings, a short-covering bounce is possible. Bulls must reclaim $70,000 to halt immediate downside momentum, though a broader trend reversal requires br#eaking back above $74,00
#WhatWillDriveCryptoandStocks’NextRebound? #USPPIMissMayEaseBTCPressure #TradFiForBeginners ) is experiencing a sharp corrective selloff, trading near $67,200 (approx. PKR 18.59 million) as of November 14, 2026. After failing to hold the psychological $70,000 threshold earlier this week, BTC has dropped over 10% since the start of November and is down roughly 23.8% year-to-date.
Technical Overview
Trend Structure: Short-term and daily market structures are decisively bearish. BTC broke down from a short-term bull flag and slipped below its 200-day simple moving average (around $73,200) and the $70,000 psychological support level.
Momentum (RSI): The daily Relative Strength Index (RSI) has dipped below 30, signaling strong downward momentum alongside oversold conditions that could trigger a short-term relief bounce.
Key Macro & Market Drivers
Hawkish Federal Reserve Expectations: Hotter-than-expected U.S. CPI inflation readings have revived expectations that the Fed may raise rates further or hold them higher for longer, pressuring zero-yielding assets like Bitcoin.
Institutional Outflows & Liquidations: U.S. spot Bitcoin ETFs recorded approximately $1.28 billion in weekly net outflows, accompanied by over $1 billion in leveraged long liquidations.
Regulatory & Equity Headwinds: Gridlock risks surrounding the U.S. CLARITY Act following the midterm elections and broader volatility in tech/AI equities have dampened institutional risk appetite.
Scenarios to Watch
Bearish Continuation: If buyers fail to defend the $66,000 floor on a daily close, selling pressure will likely test $65,000 and potentially expose the $60,000 demand zone.
Relief Bounce / Stabilization: Given oversold RSI readings, a short-covering bounce is possible. Bulls must reclaim $70,000 to halt immediate downside momentum, though a broader trend reversal requires br#eaking back above $74,00