$W $VVV $PENDLE 4-hour and daily charts turn bearish together, confirming a resonant downturn 🔥
════════════════════
🟢 $W 4-hour bearish signal
⚠️ Technical analysis: Multi-timeframe bearish confluence: 4-hour MACD bearish crossover with rising volume; green bars continue to expand; moving averages are bearishly aligned and diverging downward; KDJ K crosses below D without being oversold; daily-chart bearish confluence confirmed
════════════════════
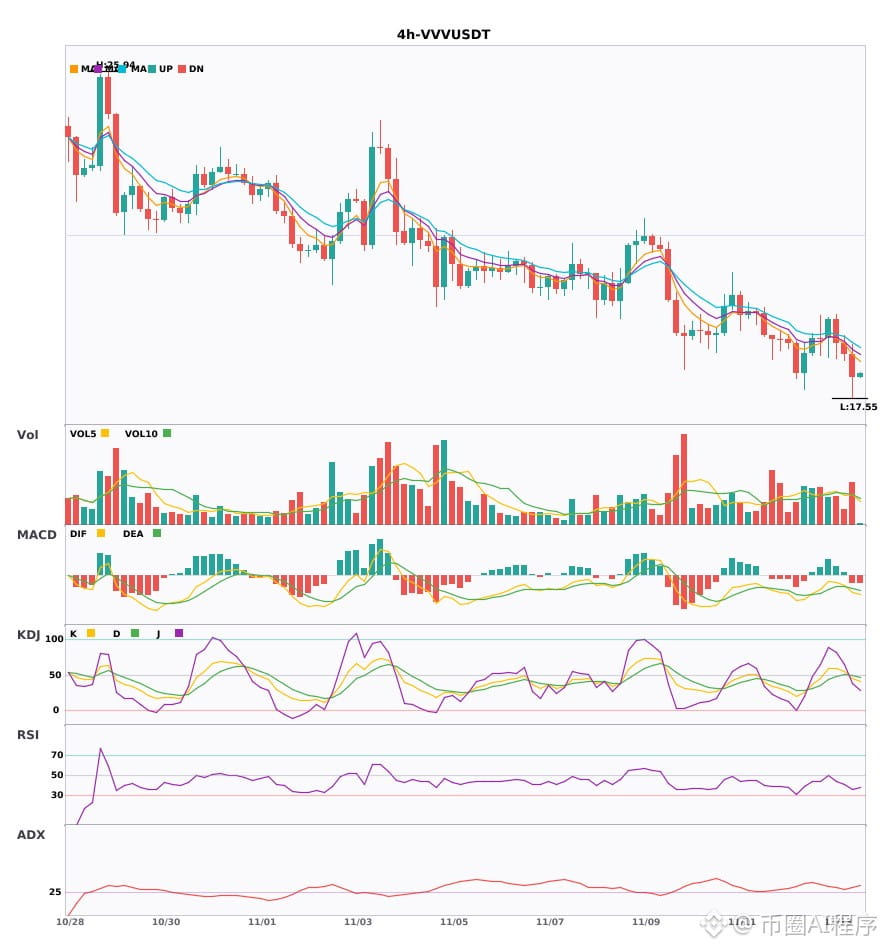
🟢 $VVV 4-hour bearish signal
⚠️ Technical analysis: 4-hour MACD bearish crossover below zero, with expanding green bars; moving averages are bearishly aligned and diverging downward; K line crosses below D line; daily-chart bearish confluence confirmed
════════════════════
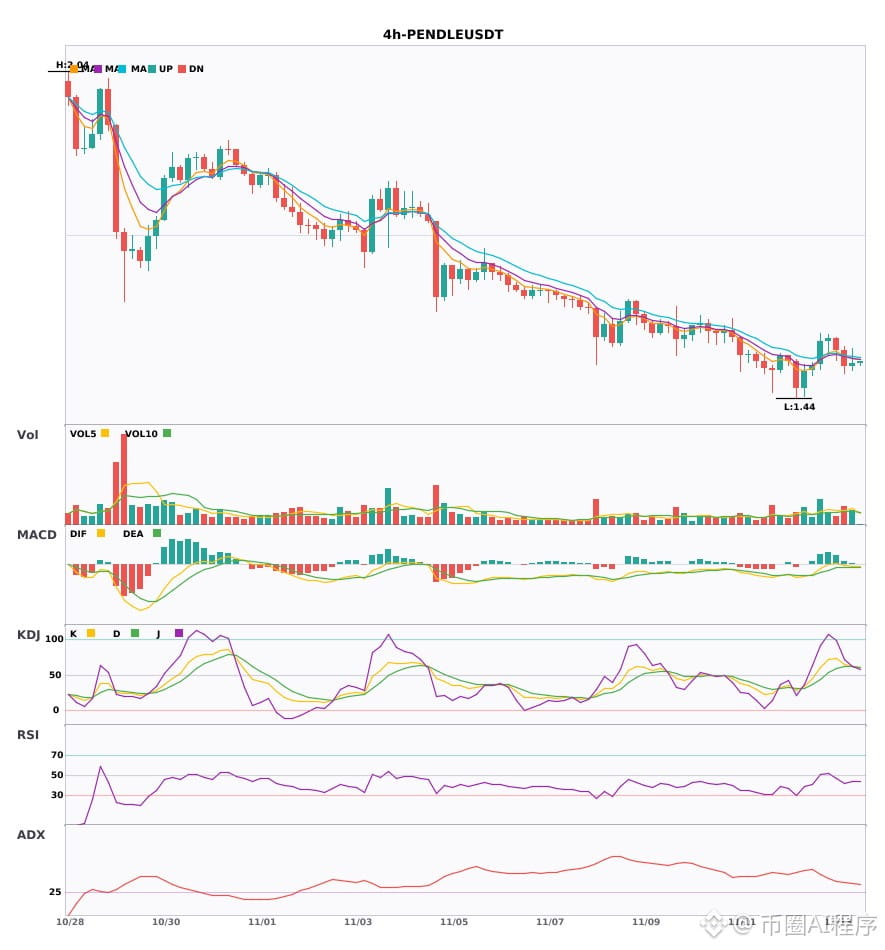
🟢 $PENDLE 4-hour bearish signal
⚠️ Technical analysis: Daily-chart bearish trend confirmed; 4-hour EMA5 crosses below EMA8, turning bearish; multi-timeframe confluence is bearish. KDJ has not weakened yet (K61.5 D61.4); volume is normal.
════════════════════
🔔 Follow for first-hand market updates 🔔
#多周期共振 #W #VVV #PENDLE
📌 When trading, pay attention to whether the candlestick patterns align
════════════════════
🟢 $W 4-hour bearish signal
⚠️ Technical analysis: Multi-timeframe bearish confluence: 4-hour MACD bearish crossover with rising volume; green bars continue to expand; moving averages are bearishly aligned and diverging downward; KDJ K crosses below D without being oversold; daily-chart bearish confluence confirmed
════════════════════
🟢 $VVV 4-hour bearish signal
⚠️ Technical analysis: 4-hour MACD bearish crossover below zero, with expanding green bars; moving averages are bearishly aligned and diverging downward; K line crosses below D line; daily-chart bearish confluence confirmed
════════════════════
🟢 $PENDLE 4-hour bearish signal
⚠️ Technical analysis: Daily-chart bearish trend confirmed; 4-hour EMA5 crosses below EMA8, turning bearish; multi-timeframe confluence is bearish. KDJ has not weakened yet (K61.5 D61.4); volume is normal.
════════════════════
🔔 Follow for first-hand market updates 🔔
#多周期共振 #W #VVV #PENDLE
📌 When trading, pay attention to whether the candlestick patterns align