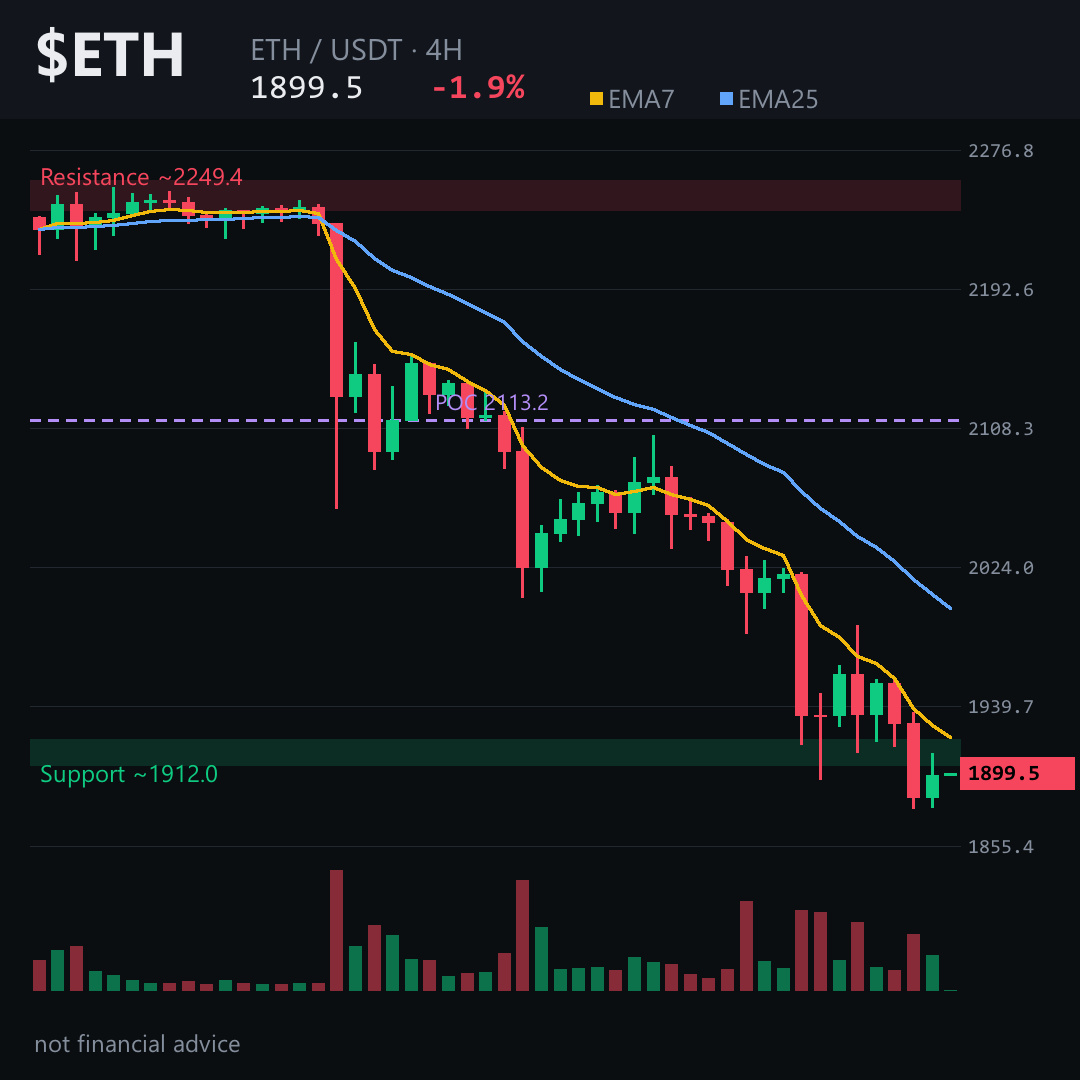
The 4‑hour EMA7 just slipped under EMA25 and $ETH is perched on the 1910‑1915 wall – a fracture point you can’t ignore.
Here’s why it matters 👇
Price is trapped below the 4‑hour EMA7, RSI languishes in the 20s and a tiny positive funding rate means longs are paying to stay – a classic over‑leveraged warning. Add a long‑short ratio of 3.6 : 1 and the market is heavily long‑biased, often a prelude to a downside swing.
If $ETH slides beneath the ~1910‑1915 zone, the next barrier is the 1985‑1990 area; a breach above that would invalidate the bearish case. Should sellers hold, the path opens toward the 1770‑1780 zone, the objective on the 4‑hour chart.
My read: ETH looks set to test the 1910‑1915 support and could drift down toward the low‑1770s if the downside momentum stays intact.
Follow me for the next update on how the 1910‑1915 area behaves and whether the price heads for the 1770‑1780 zone.
What’s your take on the 1910‑1915 level for $ETH? 👇
⚠️ Not financial advice. DYOR.
#ETH #Ethereum #Crypto #BinanceSquare
Here’s why it matters 👇
Price is trapped below the 4‑hour EMA7, RSI languishes in the 20s and a tiny positive funding rate means longs are paying to stay – a classic over‑leveraged warning. Add a long‑short ratio of 3.6 : 1 and the market is heavily long‑biased, often a prelude to a downside swing.
If $ETH slides beneath the ~1910‑1915 zone, the next barrier is the 1985‑1990 area; a breach above that would invalidate the bearish case. Should sellers hold, the path opens toward the 1770‑1780 zone, the objective on the 4‑hour chart.
My read: ETH looks set to test the 1910‑1915 support and could drift down toward the low‑1770s if the downside momentum stays intact.
Follow me for the next update on how the 1910‑1915 area behaves and whether the price heads for the 1770‑1780 zone.
What’s your take on the 1910‑1915 level for $ETH? 👇
⚠️ Not financial advice. DYOR.
#ETH #Ethereum #Crypto #BinanceSquare