
$SOL Solana Tests Critical Support as Descending Channel Nears a Turning Point
Long Setup
Entry Zone: 74.85–76.00
Stop Loss: 73.80
TP1: 81.04
TP2: 84.53
TP3: 88.02
Extended Target: 91.52
Market Structure Analysis
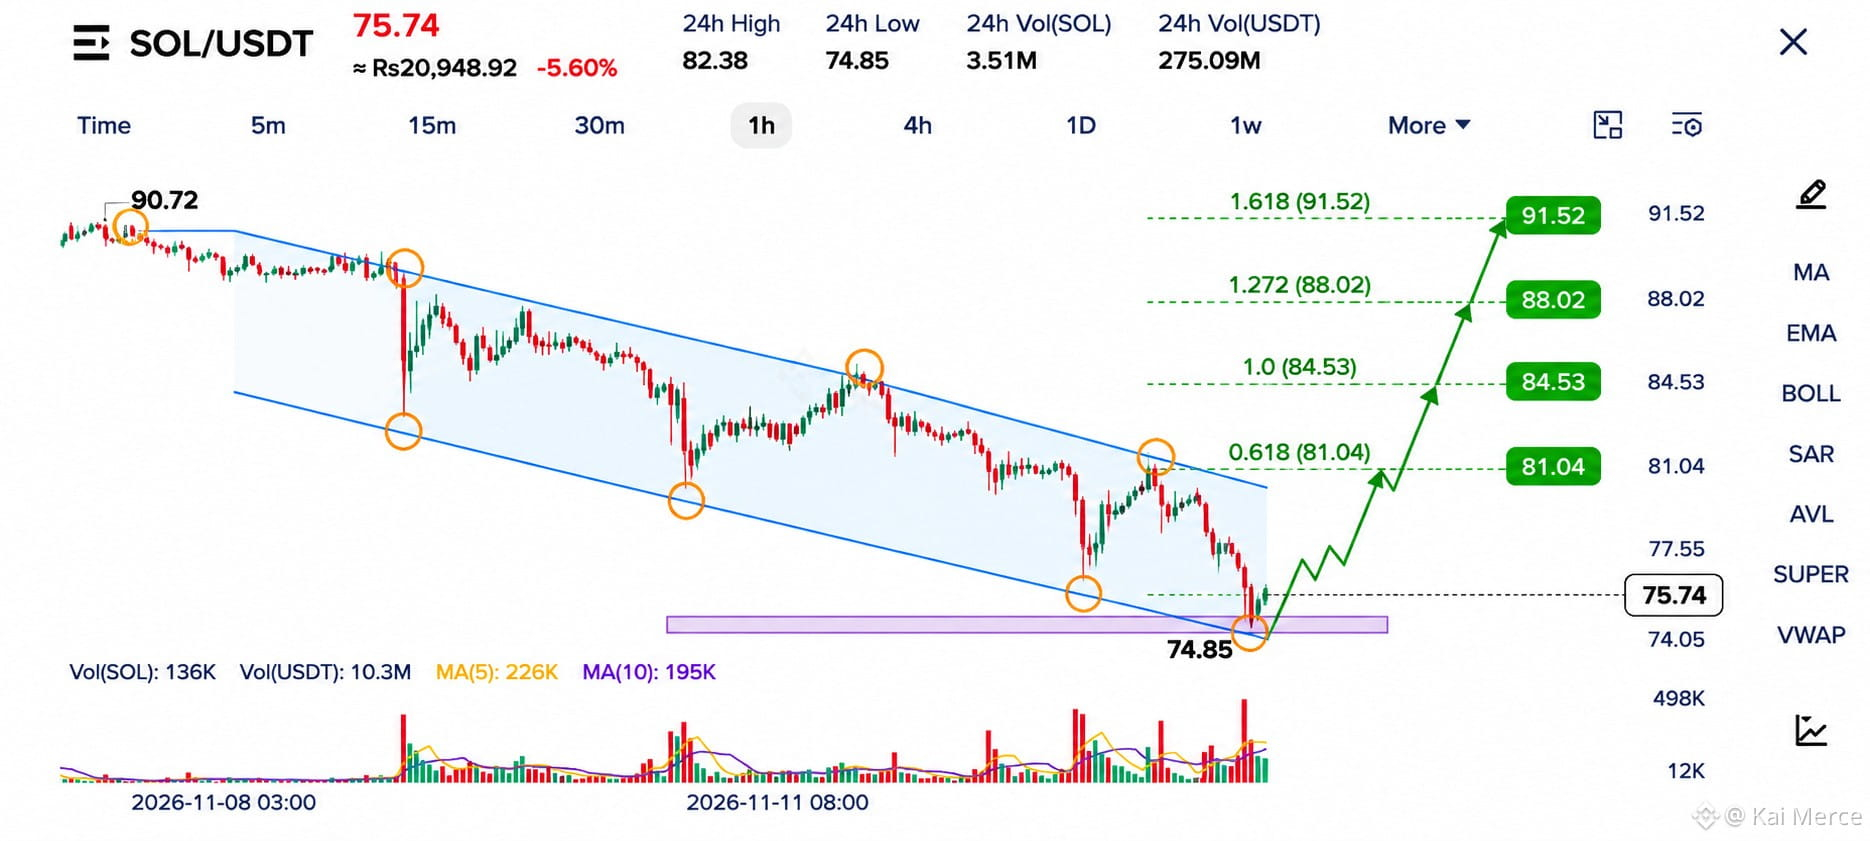
Solana is approaching an important technical support area after experiencing sustained selling pressure inside a descending channel on the 1H chart. The current price is around 75.74, with the recent low at 74.85 marking a critical level for buyers.
The chart shows a clear sequence of lower highs and lower lows, confirming that sellers have maintained control throughout the recent decline. However, price is now testing the lower boundary of the channel, where a potential recovery could begin.
The 74.85 support area is particularly important because a successful defense could trigger a relief rally toward the upper channel boundary. A breakout above descending resistance would provide an early indication of a possible trend reversal.
Fibonacci Target Analysis
The Fibonacci levels highlight several important upside objectives. The first major resistance stands at 81.04, followed by 84.53. If bullish momentum continues, SOL could extend its recovery toward 88.02 and potentially 91.52.
Increasing buying volume and a confirmed breakout will be important factors in validating this bullish scenario.
Key Levels to Watch
The 74.85 support level remains the immediate area to monitor. Holding above this level could provide buyers with an opportunity to regain control.
A decisive breakdown below 73.80 would invalidate the proposed long setup and indicate further downside risk.
Trading Strategy
Avoid entering blindly during the current volatility. Wait for a bullish reaction from support and confirmation through a strong 1H candle close.
Solana is testing a crucial demand area. The next move could determine whether buyers can turn this descending channel into a recovery opportunity.
Trade with discipline and always manage your risk.
Long Setup
Entry Zone: 74.85–76.00
Stop Loss: 73.80
TP1: 81.04
TP2: 84.53
TP3: 88.02
Extended Target: 91.52
Market Structure Analysis
Solana is approaching an important technical support area after experiencing sustained selling pressure inside a descending channel on the 1H chart. The current price is around 75.74, with the recent low at 74.85 marking a critical level for buyers.
The chart shows a clear sequence of lower highs and lower lows, confirming that sellers have maintained control throughout the recent decline. However, price is now testing the lower boundary of the channel, where a potential recovery could begin.
The 74.85 support area is particularly important because a successful defense could trigger a relief rally toward the upper channel boundary. A breakout above descending resistance would provide an early indication of a possible trend reversal.
Fibonacci Target Analysis
The Fibonacci levels highlight several important upside objectives. The first major resistance stands at 81.04, followed by 84.53. If bullish momentum continues, SOL could extend its recovery toward 88.02 and potentially 91.52.
Increasing buying volume and a confirmed breakout will be important factors in validating this bullish scenario.
Key Levels to Watch
The 74.85 support level remains the immediate area to monitor. Holding above this level could provide buyers with an opportunity to regain control.
A decisive breakdown below 73.80 would invalidate the proposed long setup and indicate further downside risk.
Trading Strategy
Avoid entering blindly during the current volatility. Wait for a bullish reaction from support and confirmation through a strong 1H candle close.
Solana is testing a crucial demand area. The next move could determine whether buyers can turn this descending channel into a recovery opportunity.
Trade with discipline and always manage your risk.