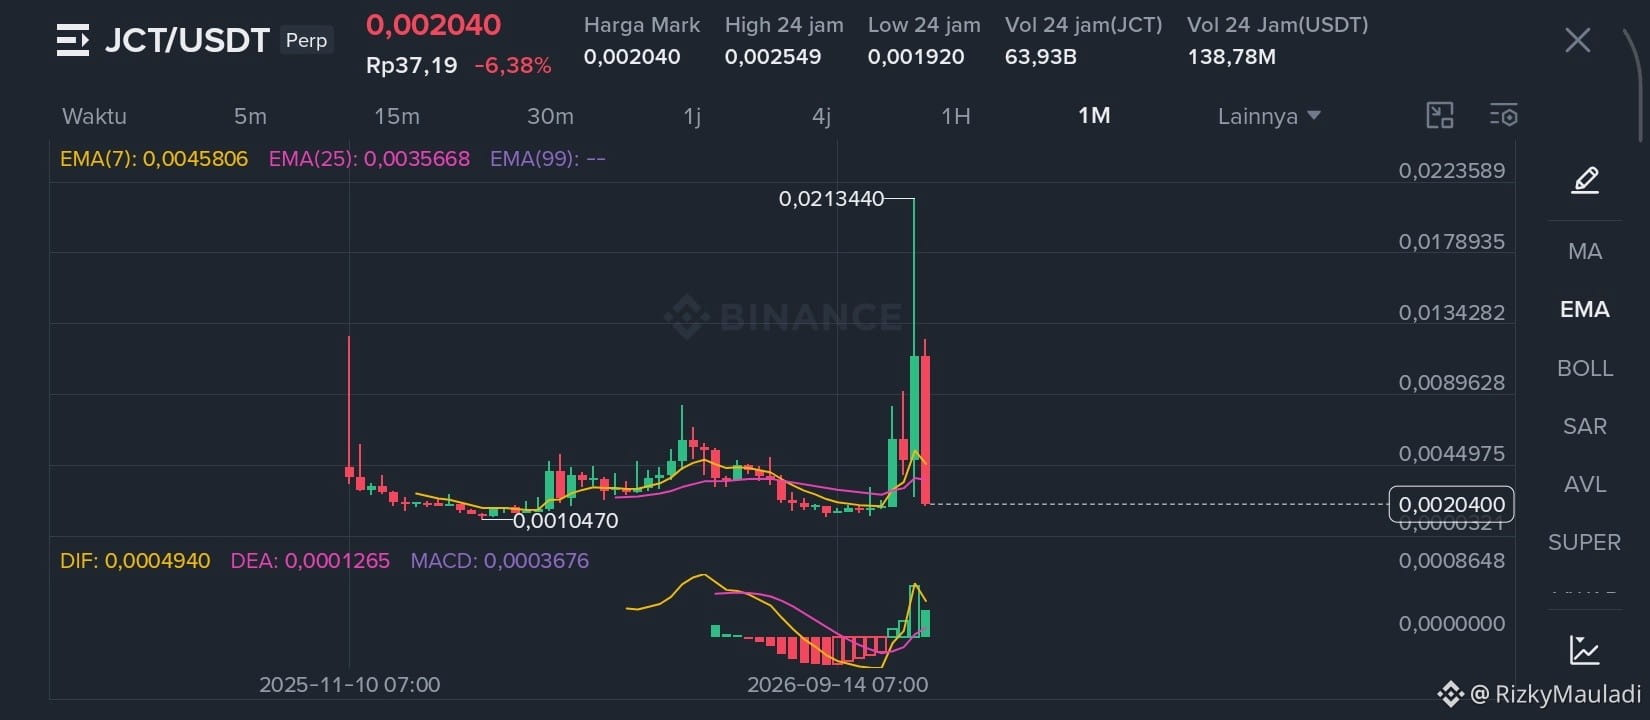
$JCT — HOLDING THE 0.0020 AREA, OR CONTINUING DOWN?
Reference live price: 0.002040.
JCT remains under heavy selling pressure following its extreme rally on November 8. The main focus now is not chasing a rebound, but watching whether the 0.0020 area can hold.
Weekly Fibonacci
Swing high reference at 0.01804 to low at 0.002016:
- 0.236: 0.014258
- 0.382: 0.011919
- 0.500: 0.010028
- 0.618: 0.008137
- 0.786: 0.005445
Note: all Fibonacci levels are far above the current price. This shows that the correction has been very deep; these levels are recovery resistance areas, not automatic targets.
Support: 0.002007–0.002000, then 0.001920.
Resistance: 0.002185, then 0.002446–0.002512.
Real market scenario:
Bullish if JCT can hold above 0.0020 and break back above 0.002185. Reclaiming 0.002446 would provide stronger confirmation of a recovery.
Bearish if the 0.0020 area is breached. The risk of retesting 0.001920 should be noted.
Latest news and conditions:
Access to JCT trading on Binance Alpha and Futures was announced on November 10. However, a listing alone is not enough to prove sustained spot demand.
The latest available market data also shows significant pressure in the derivatives market and liquidations of long positions.
Conclusion:
JCT is at a crucial area. As long as 0.0020 holds, the possibility of a technical rebound remains open. However, don't rush to assume the price has recovered before the nearest resistance has been reclaimed.
Reference live price: 0.002040.
JCT remains under heavy selling pressure following its extreme rally on November 8. The main focus now is not chasing a rebound, but watching whether the 0.0020 area can hold.
Weekly Fibonacci
Swing high reference at 0.01804 to low at 0.002016:
- 0.236: 0.014258
- 0.382: 0.011919
- 0.500: 0.010028
- 0.618: 0.008137
- 0.786: 0.005445
Note: all Fibonacci levels are far above the current price. This shows that the correction has been very deep; these levels are recovery resistance areas, not automatic targets.
Support: 0.002007–0.002000, then 0.001920.
Resistance: 0.002185, then 0.002446–0.002512.
Real market scenario:
Bullish if JCT can hold above 0.0020 and break back above 0.002185. Reclaiming 0.002446 would provide stronger confirmation of a recovery.
Bearish if the 0.0020 area is breached. The risk of retesting 0.001920 should be noted.
Latest news and conditions:
Access to JCT trading on Binance Alpha and Futures was announced on November 10. However, a listing alone is not enough to prove sustained spot demand.
The latest available market data also shows significant pressure in the derivatives market and liquidations of long positions.
Conclusion:
JCT is at a crucial area. As long as 0.0020 holds, the possibility of a technical rebound remains open. However, don't rush to assume the price has recovered before the nearest resistance has been reclaimed.