#BAT $BAT The price action over the past couple of days has been pretty ugly.
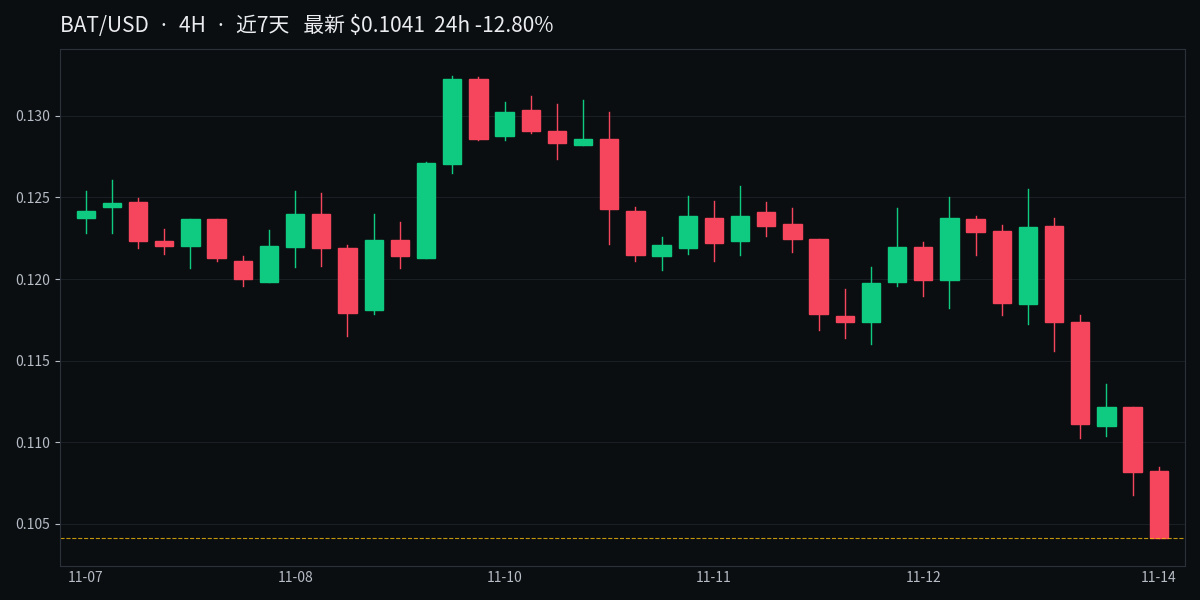
It surged to 0.1324 on November 10, then tried four or five times to break through around 0.131 and failed each time. The highs kept getting lower, forming an M-top.
It failed to break through the top, and it couldn’t hold the bottom either. Today, it fell straight through the 0.116–0.12 support zone. The current price is 0.1043, down nearly 13% in 24 hours, with volume slightly higher than the average of the past few days.
The indicators are all pointing in the same direction: MA7 at 0.1135 is below MA25 at 0.1203, RSI at 30.4 is nearing oversold territory, and MACD is still below the zero line with green bars. The price has even dropped below the Bollinger lower band at 0.1077.
Now it’s a question of whether 0.104 can hold. If it does, a short-term oversold bounce could target 0.116–0.117. If it doesn’t, the next level down is the round-number mark at 0.10.
It surged to 0.1324 on November 10, then tried four or five times to break through around 0.131 and failed each time. The highs kept getting lower, forming an M-top.
It failed to break through the top, and it couldn’t hold the bottom either. Today, it fell straight through the 0.116–0.12 support zone. The current price is 0.1043, down nearly 13% in 24 hours, with volume slightly higher than the average of the past few days.
The indicators are all pointing in the same direction: MA7 at 0.1135 is below MA25 at 0.1203, RSI at 30.4 is nearing oversold territory, and MACD is still below the zero line with green bars. The price has even dropped below the Bollinger lower band at 0.1077.
Now it’s a question of whether 0.104 can hold. If it does, a short-term oversold bounce could target 0.116–0.117. If it doesn’t, the next level down is the round-number mark at 0.10.