

Hello, fellow traders! 🐳👋
Another weekend has rolled around. This weekend, $BTC is deep in the red, dragging most altcoins sharply lower.
I expected $BTC to react well at the 200-day MA, but unfortunately, the price broke below it without hesitation. So I couldn't open a BTC long and had to watch my earlier altcoin longs sink into the red.
It’s not exactly fun having to plan for this new direction, but preparing a plan in advance and patiently waiting for orders to fill have become an essential part of my trading routine. Today, I’d like to share how I map out my scenarios, so you can see whether our approaches have anything in common!
Let’s open the BTCUSDT chart and go through each step:
📌 Step 1: Identify a potential bottom zone
Add the RSI or MACD indicator (or both) to your chart. When a bullish divergence appears on the daily timeframe, we can identify a potential bottom zone.
In particular, if the RSI bullish divergence on the daily timeframe has two troughs straddling the 30 level (meaning one trough is below 30 and the other is entirely above it), that’s a highly reliable bullish divergence signal with strong validity.
When this signal appears, we know there’s a “train station” coming up. At this point, Short traders might consider taking partial or full profits. Long traders, on the other hand, could test the waters with a small position if they find a favorable R:R ratio, while Spot traders can start accumulating more $BTC. Recognizing these “stations” along the way can make us feel much less uncertain as we ride the market train, don’t you think?
📌 Step 2: Assess bullish strength using the higher-timeframe trend and the ADX indicator
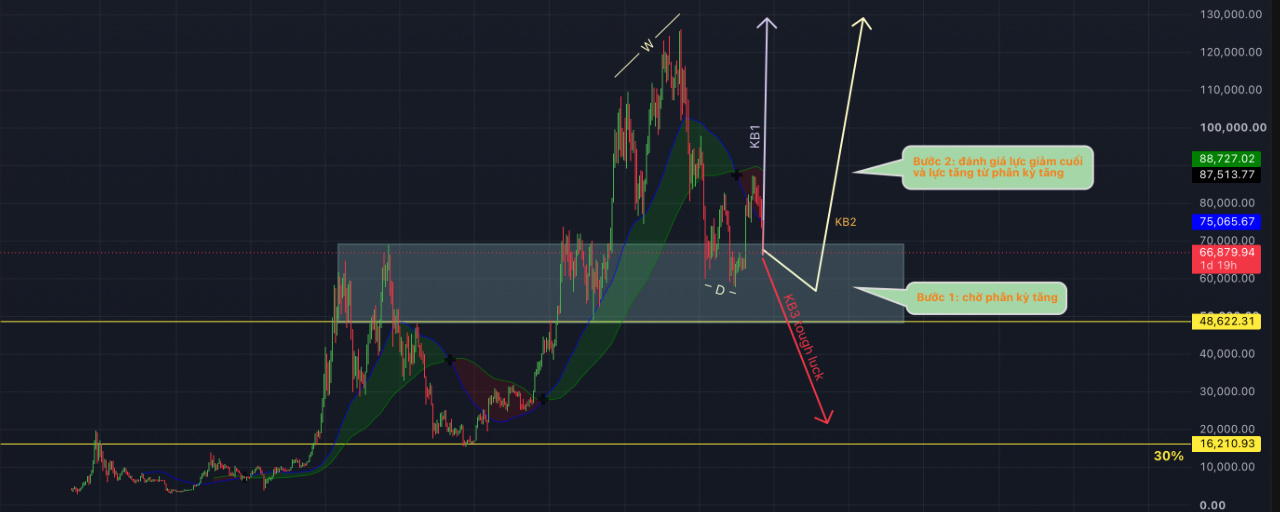
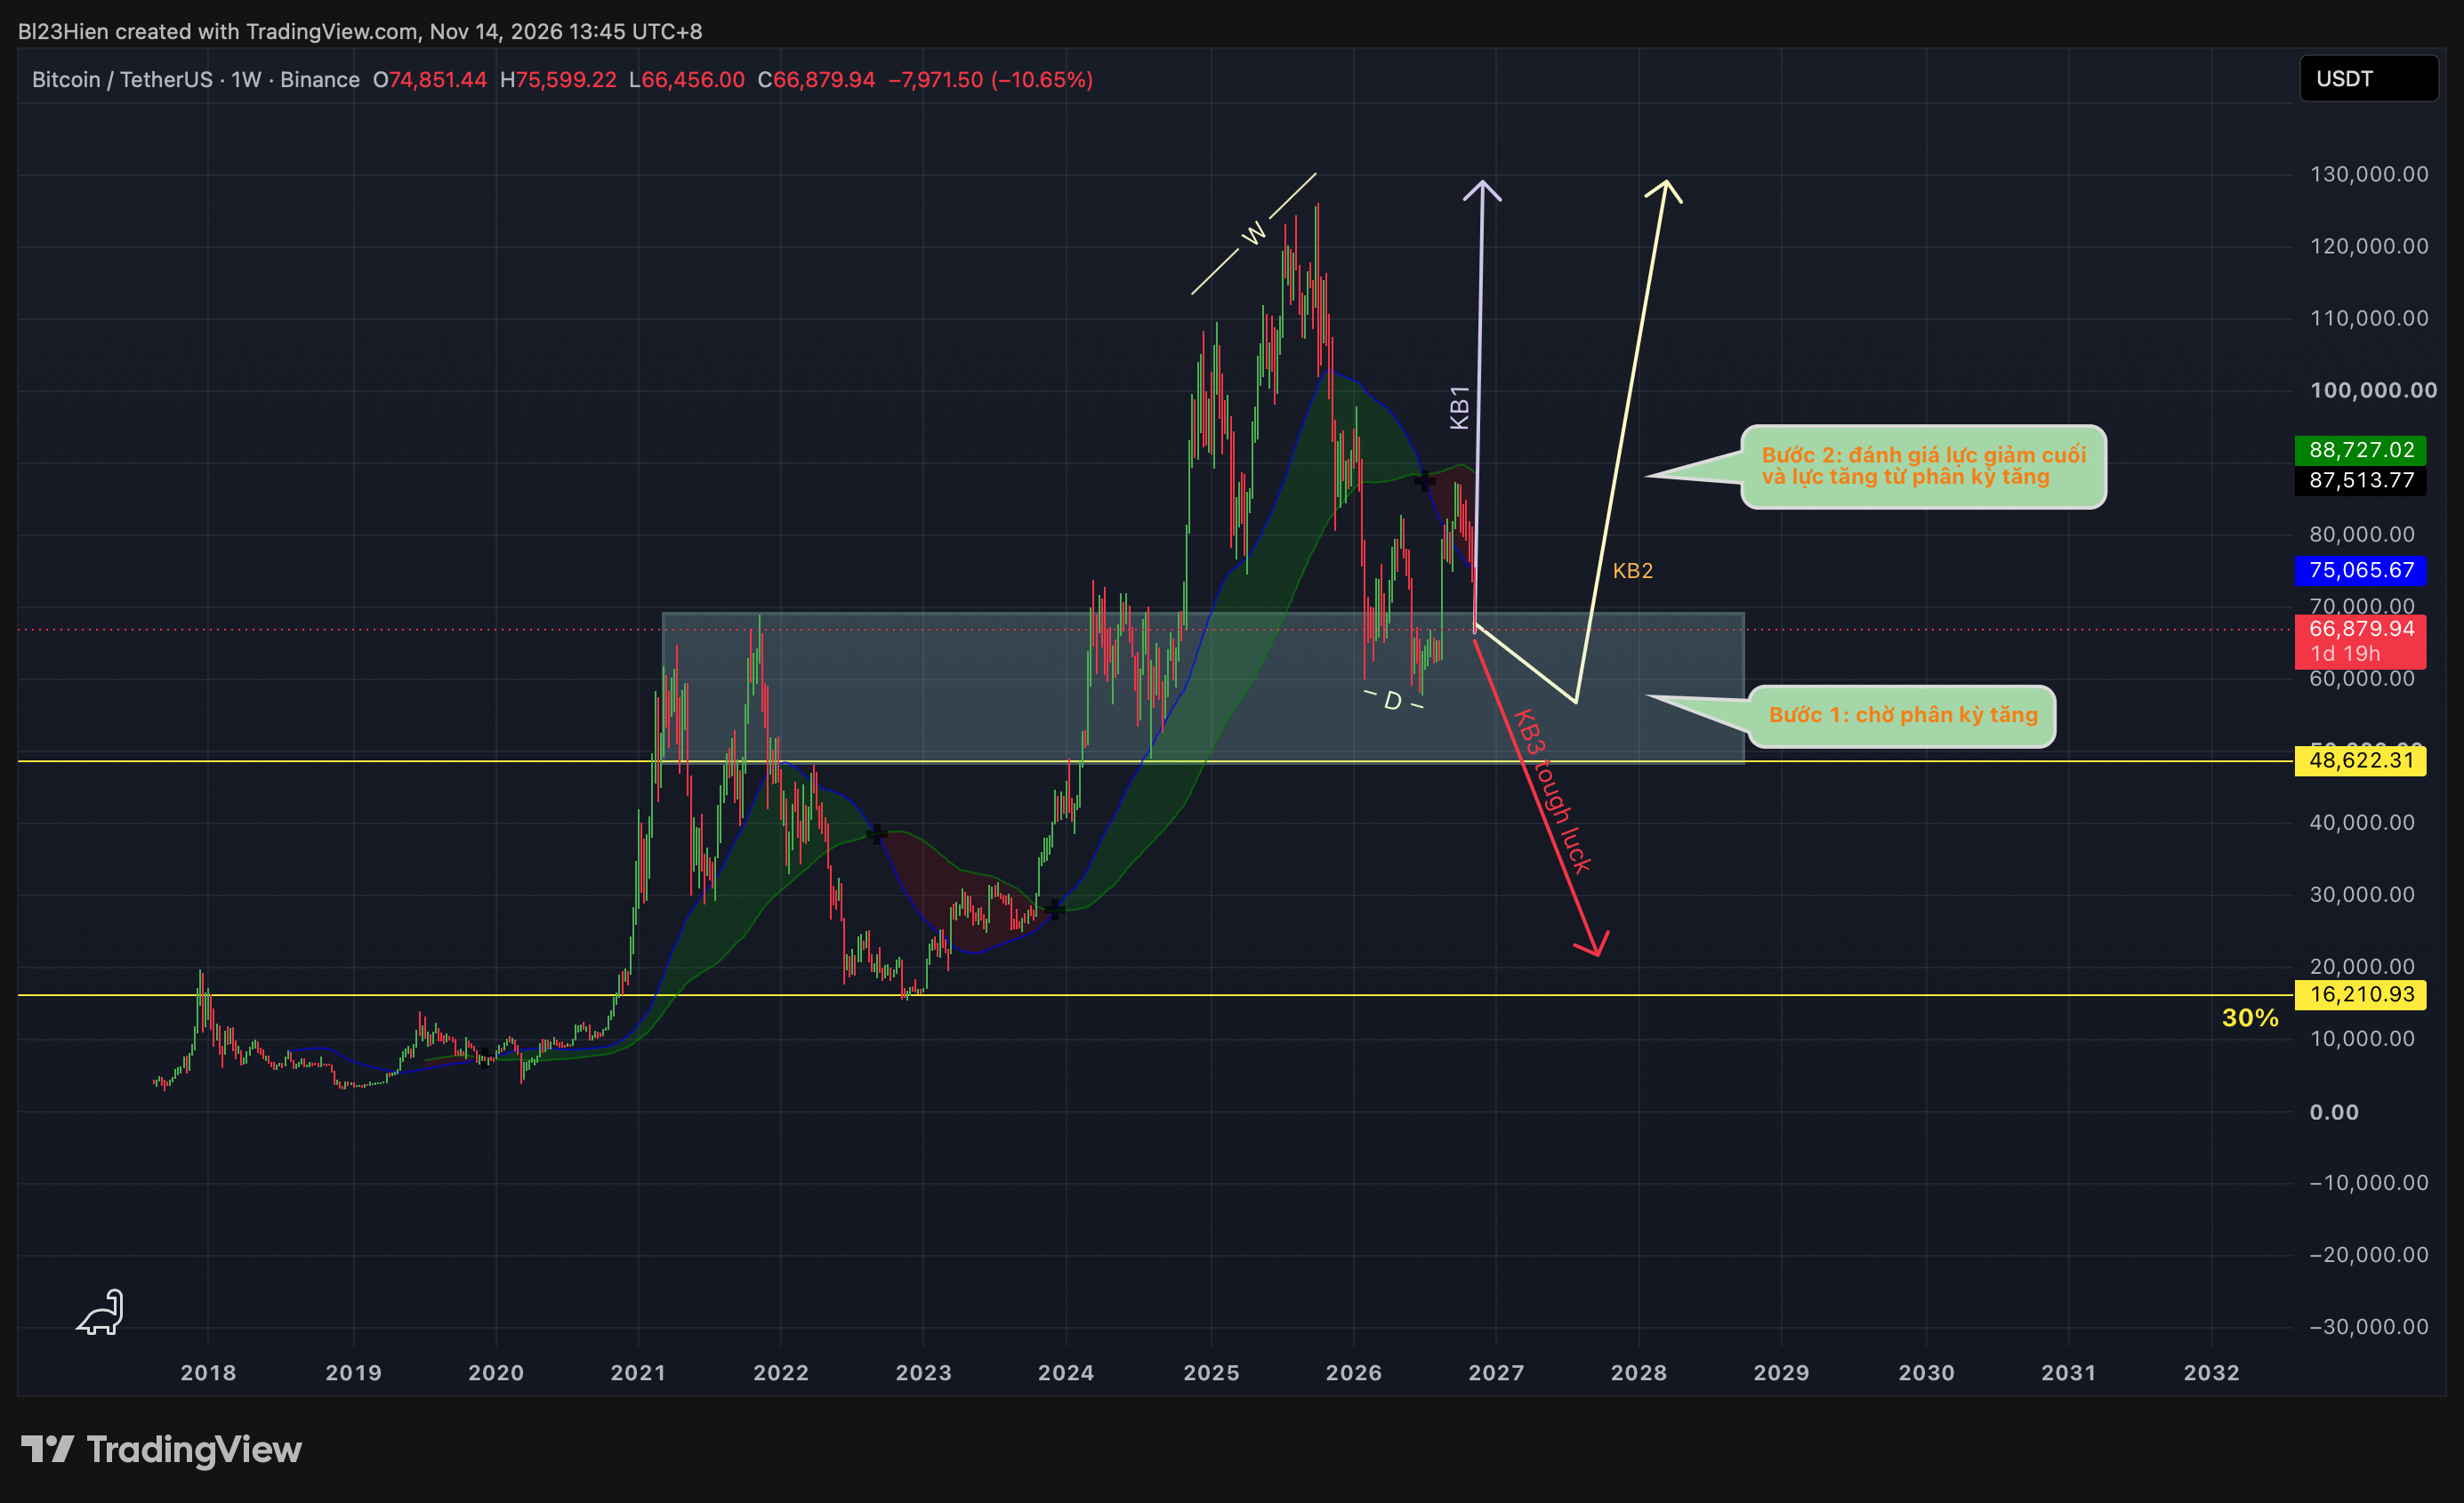
Currently, the weekly timeframe has formed a bearish divergence on both MACD and RSI. However, the monthly timeframe has not yet shown a bearish divergence on MACD, so I still expect the price to keep rising and break above the previous ATH (126.199,63 USDT).
Based on the monthly timeframe trend combined with the MACD indicator, the 15.476 USDT price zone is acting as a relatively safe support area, with a fairly low probability of being broken.
Once the daily timeframe confirms a bullish divergence, I’ll continue monitoring the strength of the downtrend using the ADX indicator. I expect ADX to stay below 57, and below 40 would be even better (currently, ADX for the downtrend is at 29,18). If ADX stays below 40 before a bullish divergence appears on RSI and MACD, that would be an excellent reversal signal.
Next, we’ll assess the strength of the move up following this divergence signal. If bullish momentum surges above 71 (since this indicator was above 70 during the strongest leg down after the previous weekly bearish divergence), it would show that buyers have completely “swallowed” the short sellers and $BTC is ready to set a new ATH.
After that strong breakout, the price may temporarily lose steam. At that point, we just need to patiently wait for the correction to end before looking for an entry.
⚠️ Backup scenario (risk management):
If $BTC doesn’t form a bullish divergence on the daily timeframe, or if the divergence signal is too weak and the price breaks straight through the weekly and monthly support zones, we’ll simply stay on the sidelines and skip this long setup altogether (tough luck—we’ll just have to accept it).
Wishing all my fellow traders good health and peace of mind—and remember to leave yourself a way out in every trade! 🤝
I hope this post will be useful to the traders who read it! 🙏
#BTC #Bitcoin #TradingStrategy #TechnicalAnalysis #CryptoTrading