$BERA
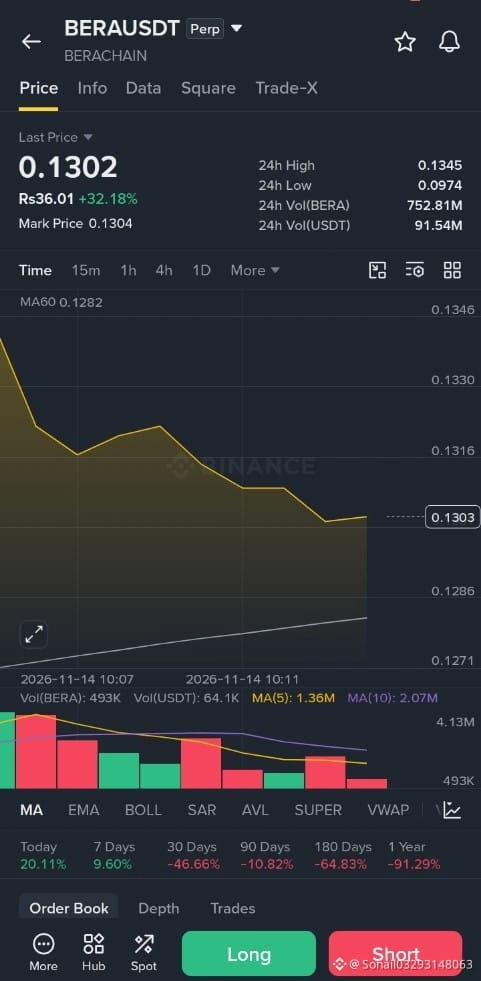
#BERAUSDT is currently trading near $0.1035 – $0.1055, attempting to stabilize just above its all-time low of $0.0960 set on November 12, 2026.
5-Line Chart Description & Analysis
1. Macro Downtrend: The higher-timeframe chart remains heavily bearish, with BERA trading well below all major moving averages from the MA5 to MA200 and down over 98% from its launch peak.
2. Critical Floor: Price recently swept liquidity down to $0.0960 – $0.1000 and is currently coiling in a tight consolidation range right above the psychological $0.1000 support.
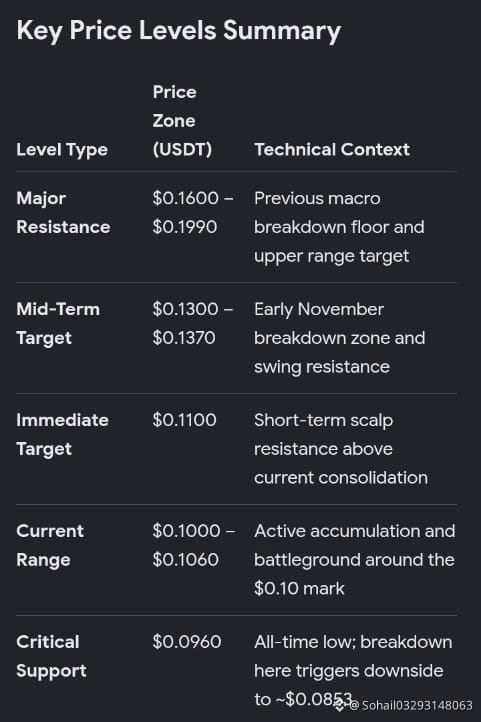
3. Immediate Upside Target: Holding above $0.1000 opens a short-term relief bounce toward $0.1100, followed by a secondary recovery target at $0.1300 – $0.1370.
4. Bullish Breakout Target: A sustained move with strong volume above $0.1370 would confirm a trend shift toward the $0.1600 – $0.1990 resistance zone.
5. Downside Invalidation: Losing the $0.0960 historical low on a daily close invalidates the bounce setup and exposes the chart to further price discovery toward $0.0850.
#SpaceXTeslaMergerTalksWouldCombine30220BTC
#USPPIMissMayEaseBTCPressure
#BitcoinBreaksBelow200WeekMovingAverage
#WhatWillDriveCryptoandStocks’NextRebound?
#BERAUSDT is currently trading near $0.1035 – $0.1055, attempting to stabilize just above its all-time low of $0.0960 set on November 12, 2026.
5-Line Chart Description & Analysis
1. Macro Downtrend: The higher-timeframe chart remains heavily bearish, with BERA trading well below all major moving averages from the MA5 to MA200 and down over 98% from its launch peak.
2. Critical Floor: Price recently swept liquidity down to $0.0960 – $0.1000 and is currently coiling in a tight consolidation range right above the psychological $0.1000 support.
3. Immediate Upside Target: Holding above $0.1000 opens a short-term relief bounce toward $0.1100, followed by a secondary recovery target at $0.1300 – $0.1370.
4. Bullish Breakout Target: A sustained move with strong volume above $0.1370 would confirm a trend shift toward the $0.1600 – $0.1990 resistance zone.
5. Downside Invalidation: Losing the $0.0960 historical low on a daily close invalidates the bounce setup and exposes the chart to further price discovery toward $0.0850.
#SpaceXTeslaMergerTalksWouldCombine30220BTC
#USPPIMissMayEaseBTCPressure
#BitcoinBreaksBelow200WeekMovingAverage
#WhatWillDriveCryptoandStocks’NextRebound?