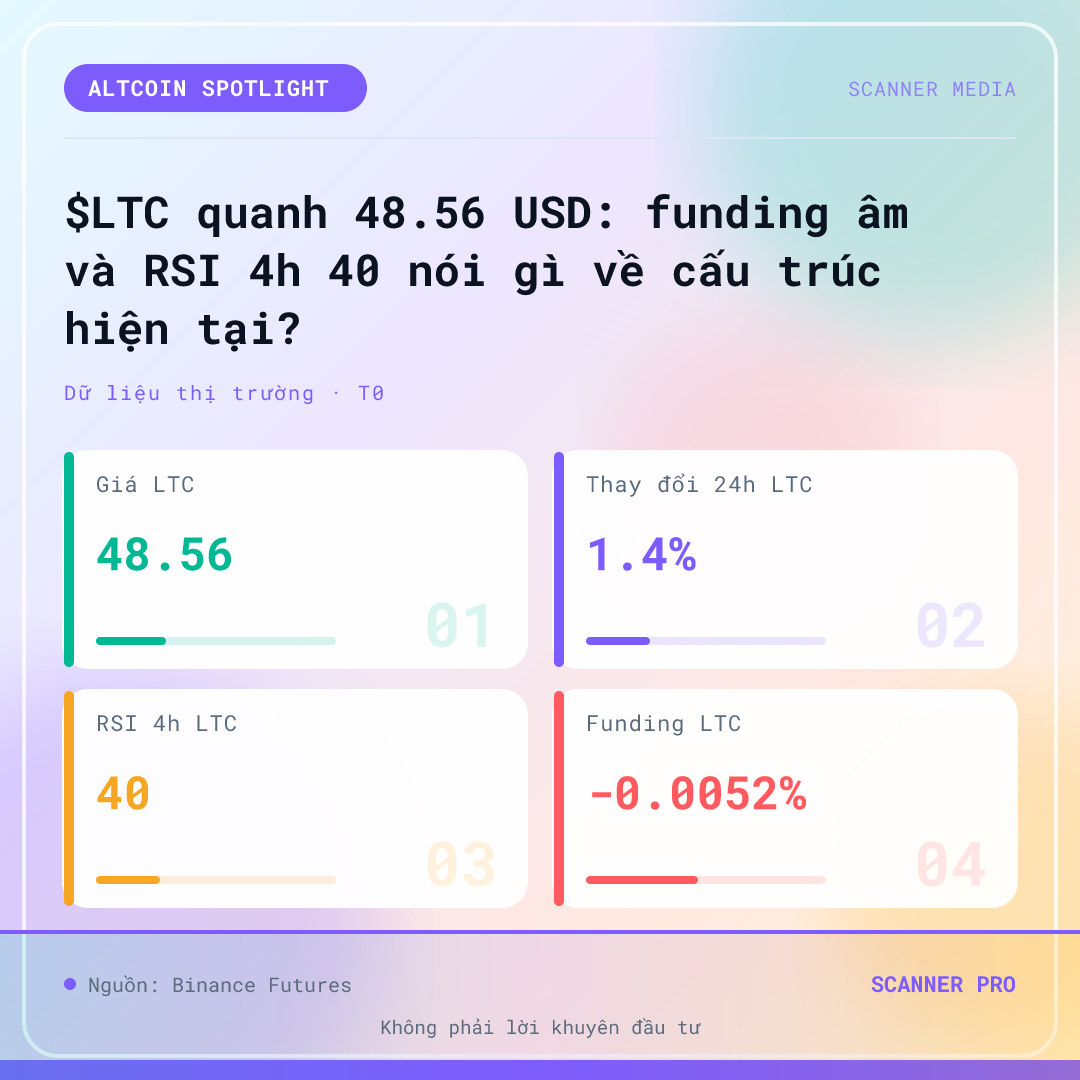
$LTC Around 48.56 USD: what do negative funding and an RSI of 40 on the 4h chart say about the current structure?
$LTC is trading around 48.56 USD, up 1.4% over 24 hours while BTC, ETH, and SOL are all down. Negative funding of -0.0052% and an RSI of 40 on the 4h chart suggest selling pressure has eased, but there is no confirmed reversal yet, and thin liquidity is something to watch.
Price and volume data
According to the Binance Futures snapshot at 04:40 on 14/11/2026, $LTC is trading at 48.56 USD, up 1.4% over 24 hours. LTC’s 24-hour trading volume is 0.07 billion USDT, several orders of magnitude below that of the major coins in the same snapshot. The price moving against the broader market is a notable signal, but thin liquidity limits its reliability.
Negative funding and an RSI of 40 on the 4h chart
LTC funding is at -0.0052%, meaning short sellers are paying longs. This condition often occurs when selling pressure is dominant and short positions are increasing, but it may also reflect the market betting on a further decline. An RSI of 40 on the 4h chart, and an RSI of 40 on the 1h chart as well, indicate that momentum has not entered deeply oversold territory, while also not having risen above the neutral zone…
Contrary scenario: If LTC liquidity thins and the price loses its short-term support zone, the current structure is no longer valid.
Source: Binance Futures (11:40 14-11)
This technical analysis is for educational purposes only and is not investment advice. Cryptocurrency trading involves high risk, and you could lose all your capital. Do your own research and take responsibility for your decisions.
#Binance #Crypto #Futures
$LTC is trading around 48.56 USD, up 1.4% over 24 hours while BTC, ETH, and SOL are all down. Negative funding of -0.0052% and an RSI of 40 on the 4h chart suggest selling pressure has eased, but there is no confirmed reversal yet, and thin liquidity is something to watch.
Price and volume data
According to the Binance Futures snapshot at 04:40 on 14/11/2026, $LTC is trading at 48.56 USD, up 1.4% over 24 hours. LTC’s 24-hour trading volume is 0.07 billion USDT, several orders of magnitude below that of the major coins in the same snapshot. The price moving against the broader market is a notable signal, but thin liquidity limits its reliability.
Negative funding and an RSI of 40 on the 4h chart
LTC funding is at -0.0052%, meaning short sellers are paying longs. This condition often occurs when selling pressure is dominant and short positions are increasing, but it may also reflect the market betting on a further decline. An RSI of 40 on the 4h chart, and an RSI of 40 on the 1h chart as well, indicate that momentum has not entered deeply oversold territory, while also not having risen above the neutral zone…
Contrary scenario: If LTC liquidity thins and the price loses its short-term support zone, the current structure is no longer valid.
Source: Binance Futures (11:40 14-11)
This technical analysis is for educational purposes only and is not investment advice. Cryptocurrency trading involves high risk, and you could lose all your capital. Do your own research and take responsibility for your decisions.
#Binance #Crypto #Futures