$WBETH: Would Indicator Agreement Be Independent Evidence?
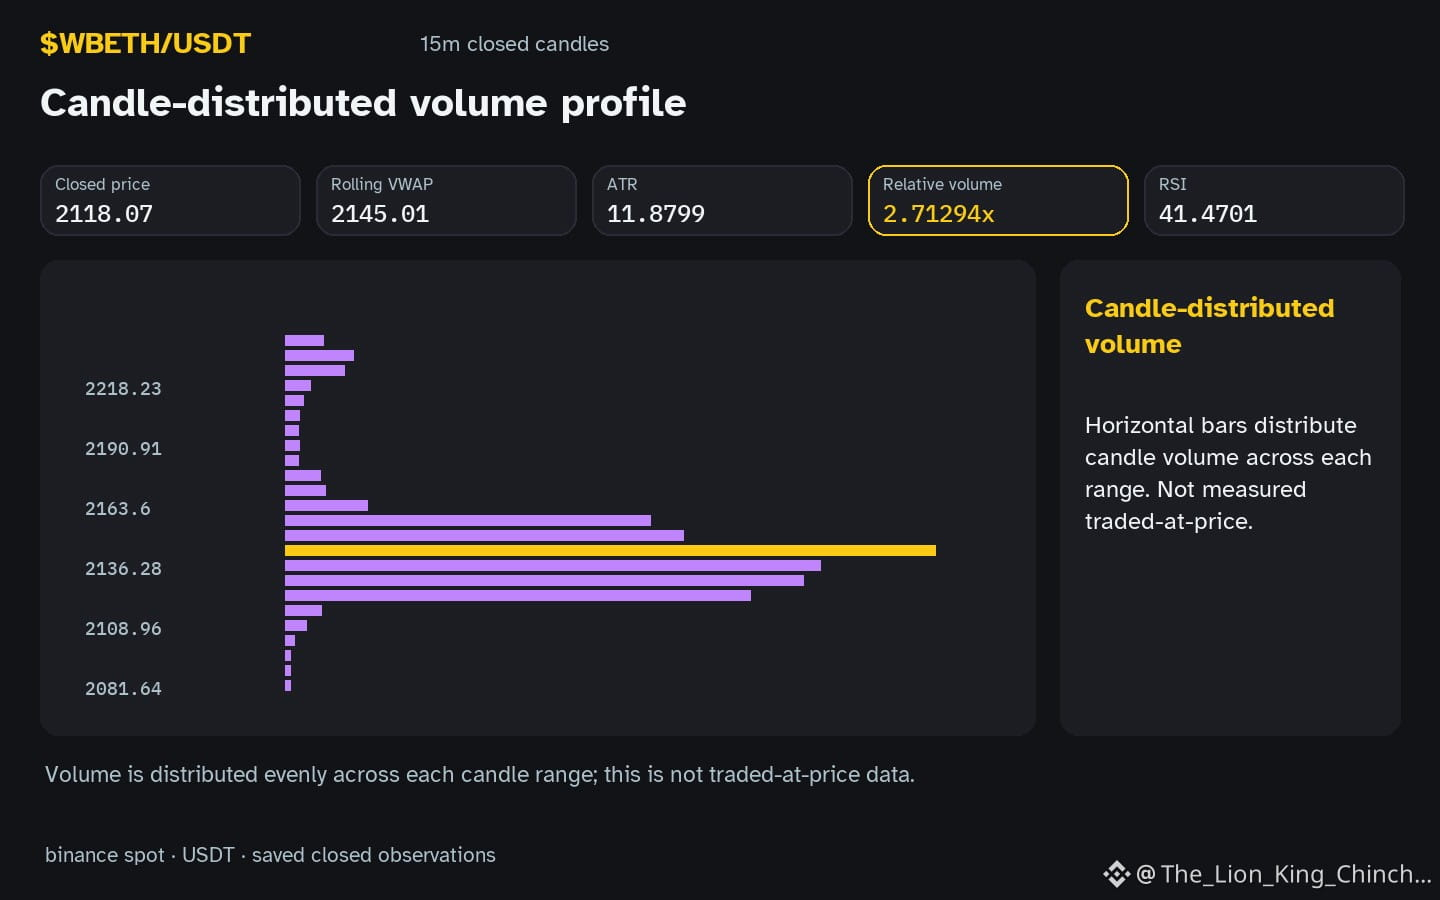
Does $WBETH show a confluence of value and trend now? The recorded picture sits inside the local range with hourly direction down and relative volume 2.71x baseline. This snapshot is a hypothetical mechanism, not proof of trader intent. A common shortcut assumes that when price nears support and momentum aligns, the move is likely to continue. That view treats indicators as independent validators. However, RSI 41.5 and price levels often derive from the same recent candles, creating redundancy. A more careful interpretation views these zones as areas where multiple conditions overlap, not as causal guarantees. If price closes below the local support level, the trend interpretation weakens because the structural premise fails. Conversely, if volume stays flat while price holds, the conviction behind the move is questionable. A counterexample would be a day when indicators agree but price reverses immediately after touching the zone, showing that correlation is not causation. To test this, check if future closed candles confirm the move beyond the range. If they do not, the confluence was merely noise. This exercise helps distinguish mechanical overlap from genuine market structure, keeping the analysis grounded in observed data rather than assumed dynamics.
Probabilistic market research, not a recommendation or guaranteed return.
#WBETH
Does $WBETH show a confluence of value and trend now? The recorded picture sits inside the local range with hourly direction down and relative volume 2.71x baseline. This snapshot is a hypothetical mechanism, not proof of trader intent. A common shortcut assumes that when price nears support and momentum aligns, the move is likely to continue. That view treats indicators as independent validators. However, RSI 41.5 and price levels often derive from the same recent candles, creating redundancy. A more careful interpretation views these zones as areas where multiple conditions overlap, not as causal guarantees. If price closes below the local support level, the trend interpretation weakens because the structural premise fails. Conversely, if volume stays flat while price holds, the conviction behind the move is questionable. A counterexample would be a day when indicators agree but price reverses immediately after touching the zone, showing that correlation is not causation. To test this, check if future closed candles confirm the move beyond the range. If they do not, the confluence was merely noise. This exercise helps distinguish mechanical overlap from genuine market structure, keeping the analysis grounded in observed data rather than assumed dynamics.
Probabilistic market research, not a recommendation or guaranteed return.
#WBETH