

Korean trading legend Kim Hyung-jun made 15 to 20 billion won through trading, or roughly 15 million US dollars.
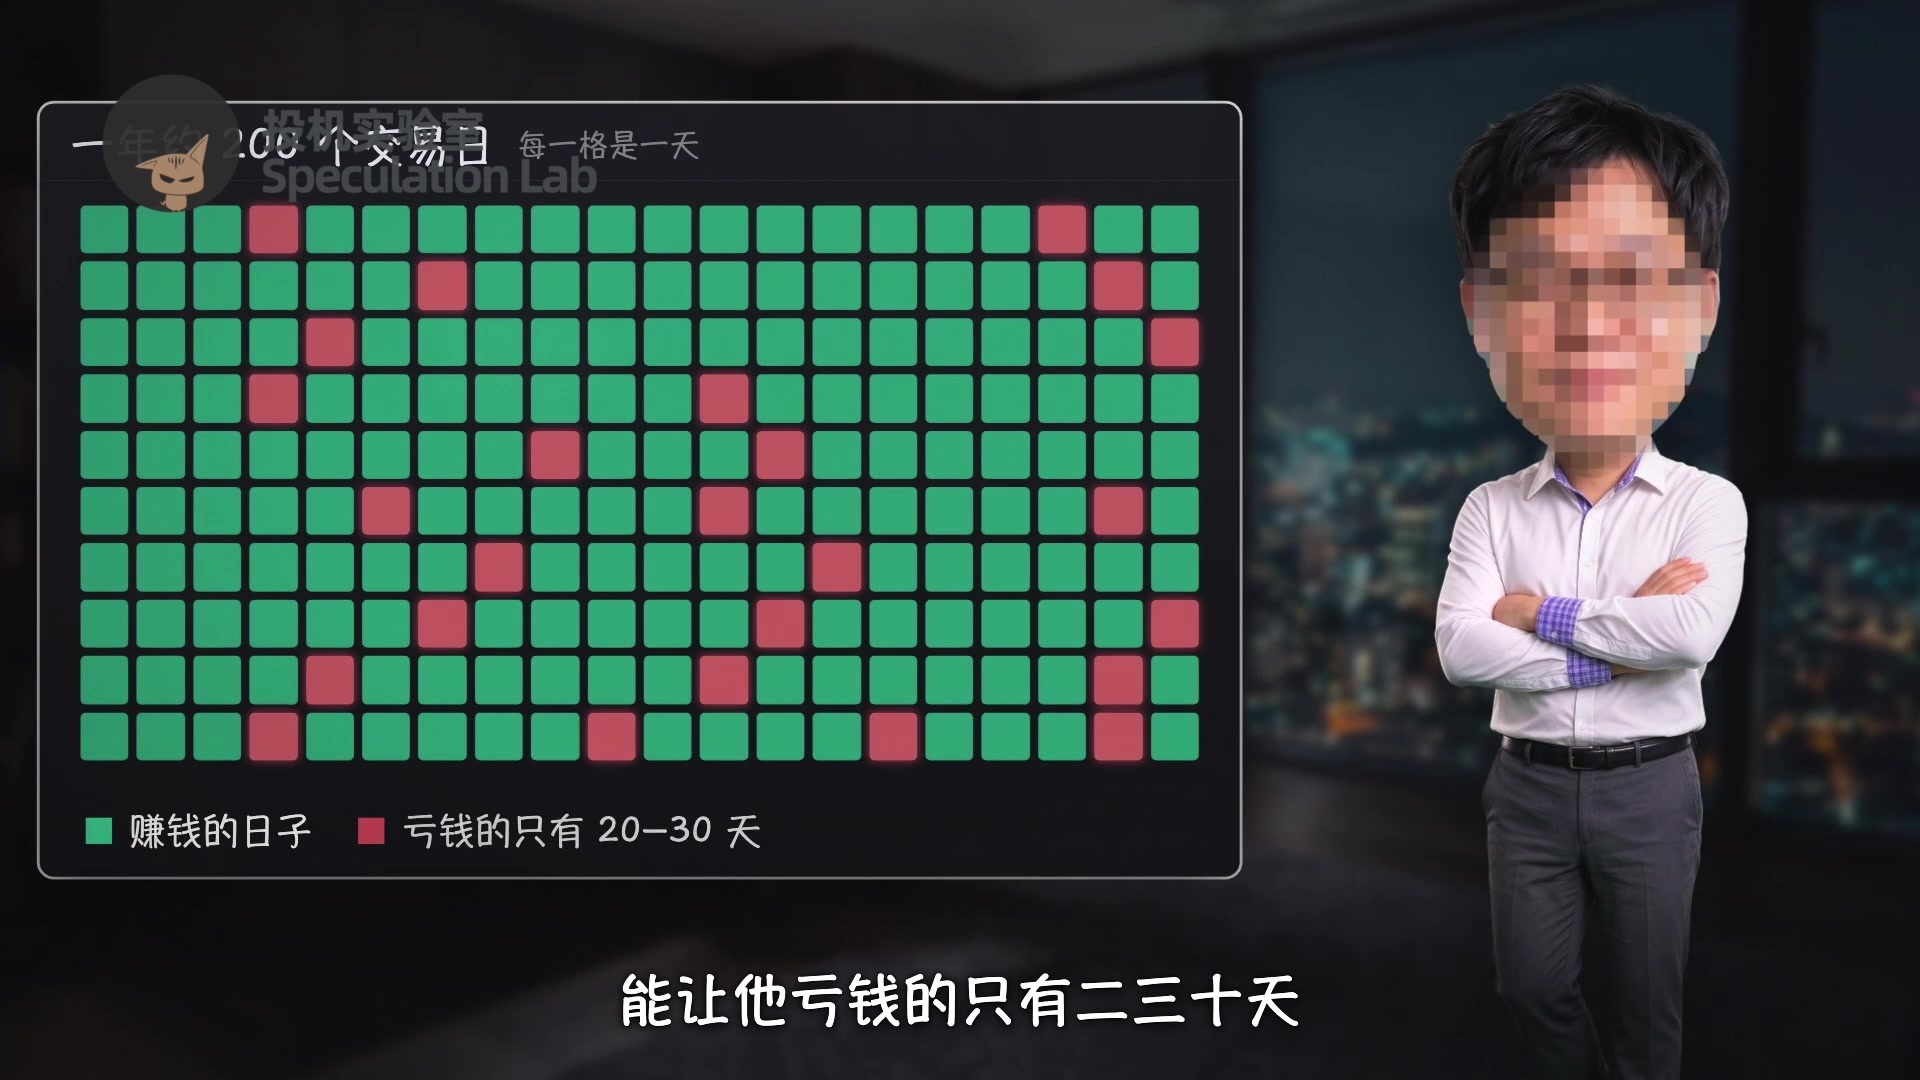
His method came down to one thing: an incredibly high win rate. Out of more than 200 trading days a year, only 20 or 30 would leave him in the red. In his 15 years of full-time trading, he only had two losing months—and he was very unlucky during those two months.
He entered live trading competitions many times and won first place four times. When he appeared on a TV show in 2020, he revealed his trading account; one of his accounts made over $600,000 in less than two months.
In one competition, he entered the small-capital group with three million won and achieved a 429 percent return in less than two months.

This guy is incredible. The show’s ratings took off too: the three-hour program had more than 2.3 million views. In the eyes of Korean retail investors, he’s an absolute legend.
I’ve uncovered his trading strategy, called the New High Method, and it works incredibly well. Without further ado, let’s get started.

He’s a short-term trader who mainly picks the hottest, most actively traded stocks. The idea behind the New High Method is to wait for a stock to surge, pull back, and then enter.
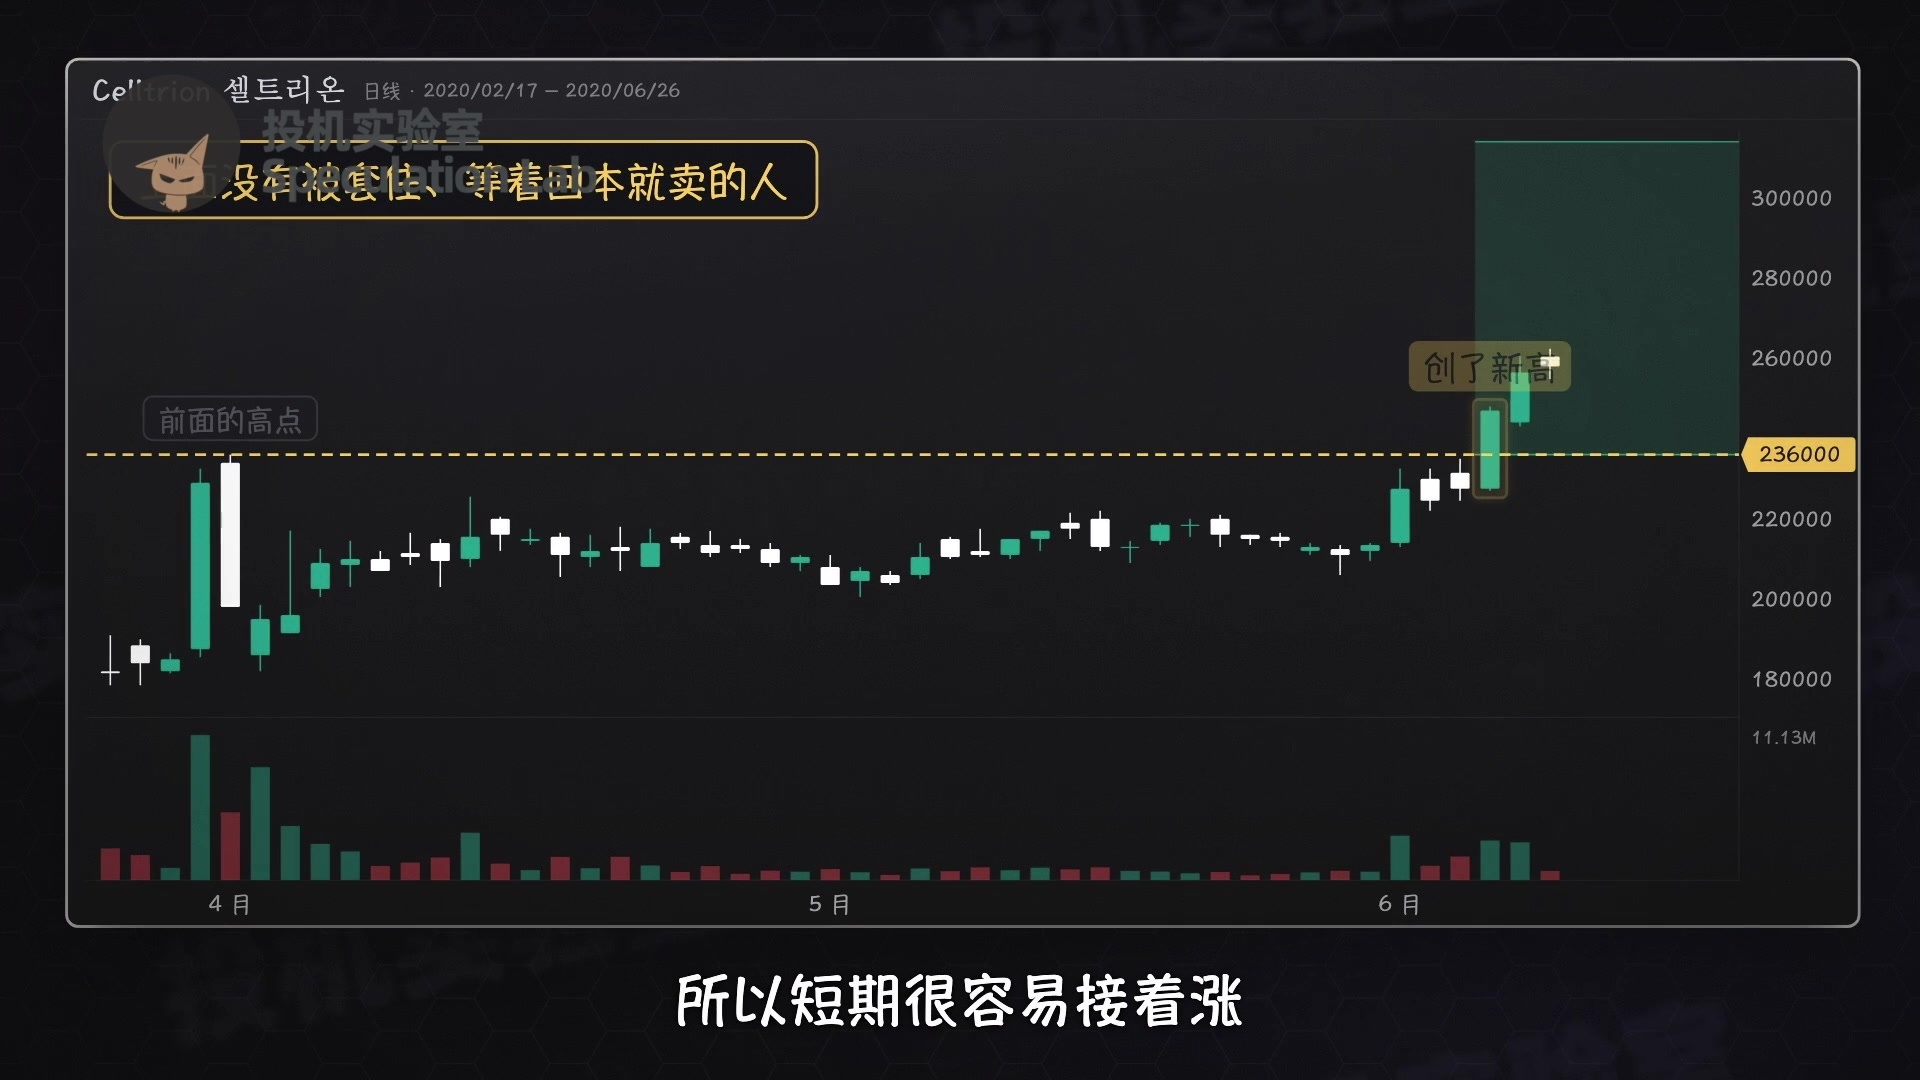
When a stock reaches a new high, it means there are no investors above that price who are stuck waiting to break even and sell. So, in the short term, the stock is more likely to keep rising.
But a new high is usually reached after a long bullish candle pushes the price up. If you chase it that day, you’re buying at the top. And many stocks hit new highs intraday, only to fall back by the close, leaving people who chased them stuck with losses that same day.
So he waits for a bearish candle and a pullback before buying. He came up with this strategy after reviewing countless times he’d lost money chasing bullish candles.

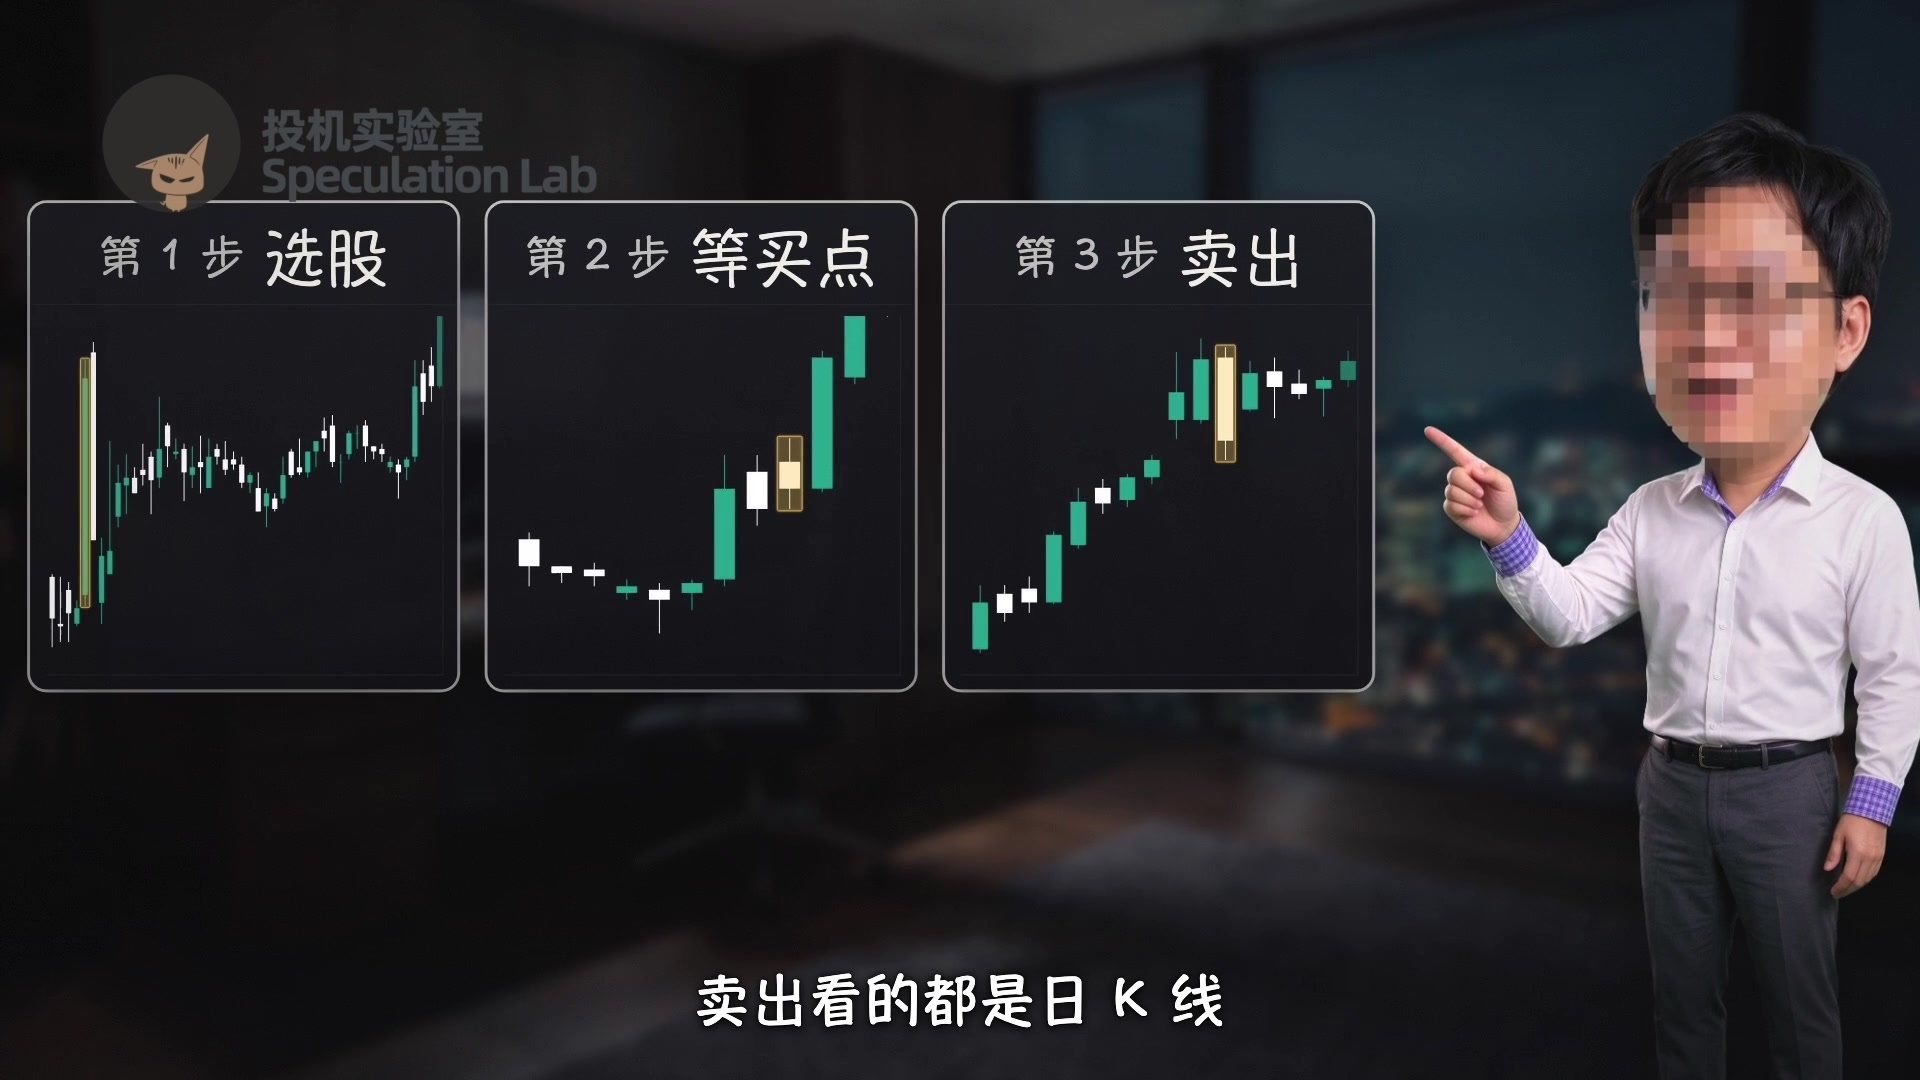
The New High Method has three steps: choose a stock, wait for an entry point, and sell. He uses daily candlestick charts throughout. The day before, he picks which stocks to trade the next day and plans in advance how to sell if they rise and where to cut losses if they fall.
First, choosing a stock. Start by looking at its trading value—that is, how much money changed hands during the day.
Cheap stocks can have high trading volume but low trading value. He wants stocks that attract lots of money and lots of traders—stocks that are easy to buy and sell.
So he looks at the top 50 stocks by daily trading value, excludes ETFs, and then picks those linked to new themes.
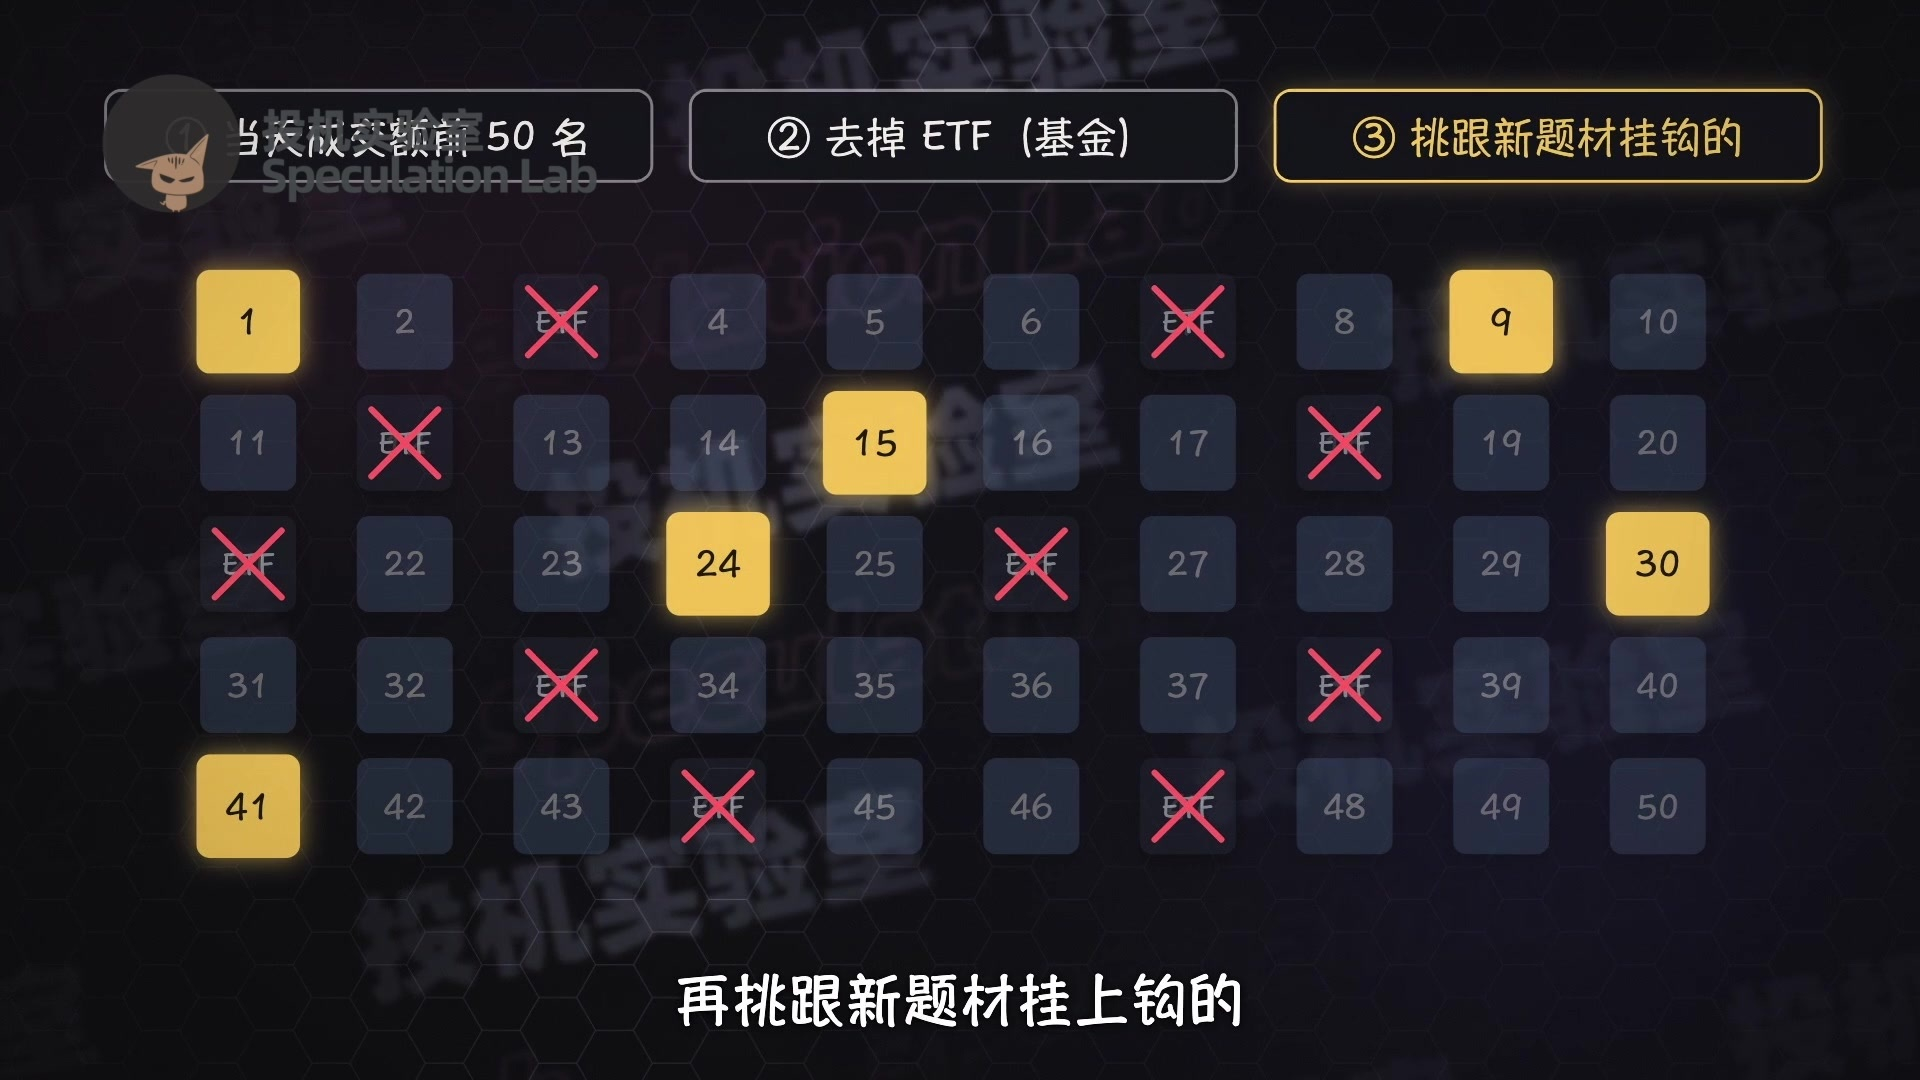
If he buys a stock with low trading value, he only buys a little. He usually trades in large amounts, so if he needs to cut his losses in one of these stocks, his own sell order could drive the price down.
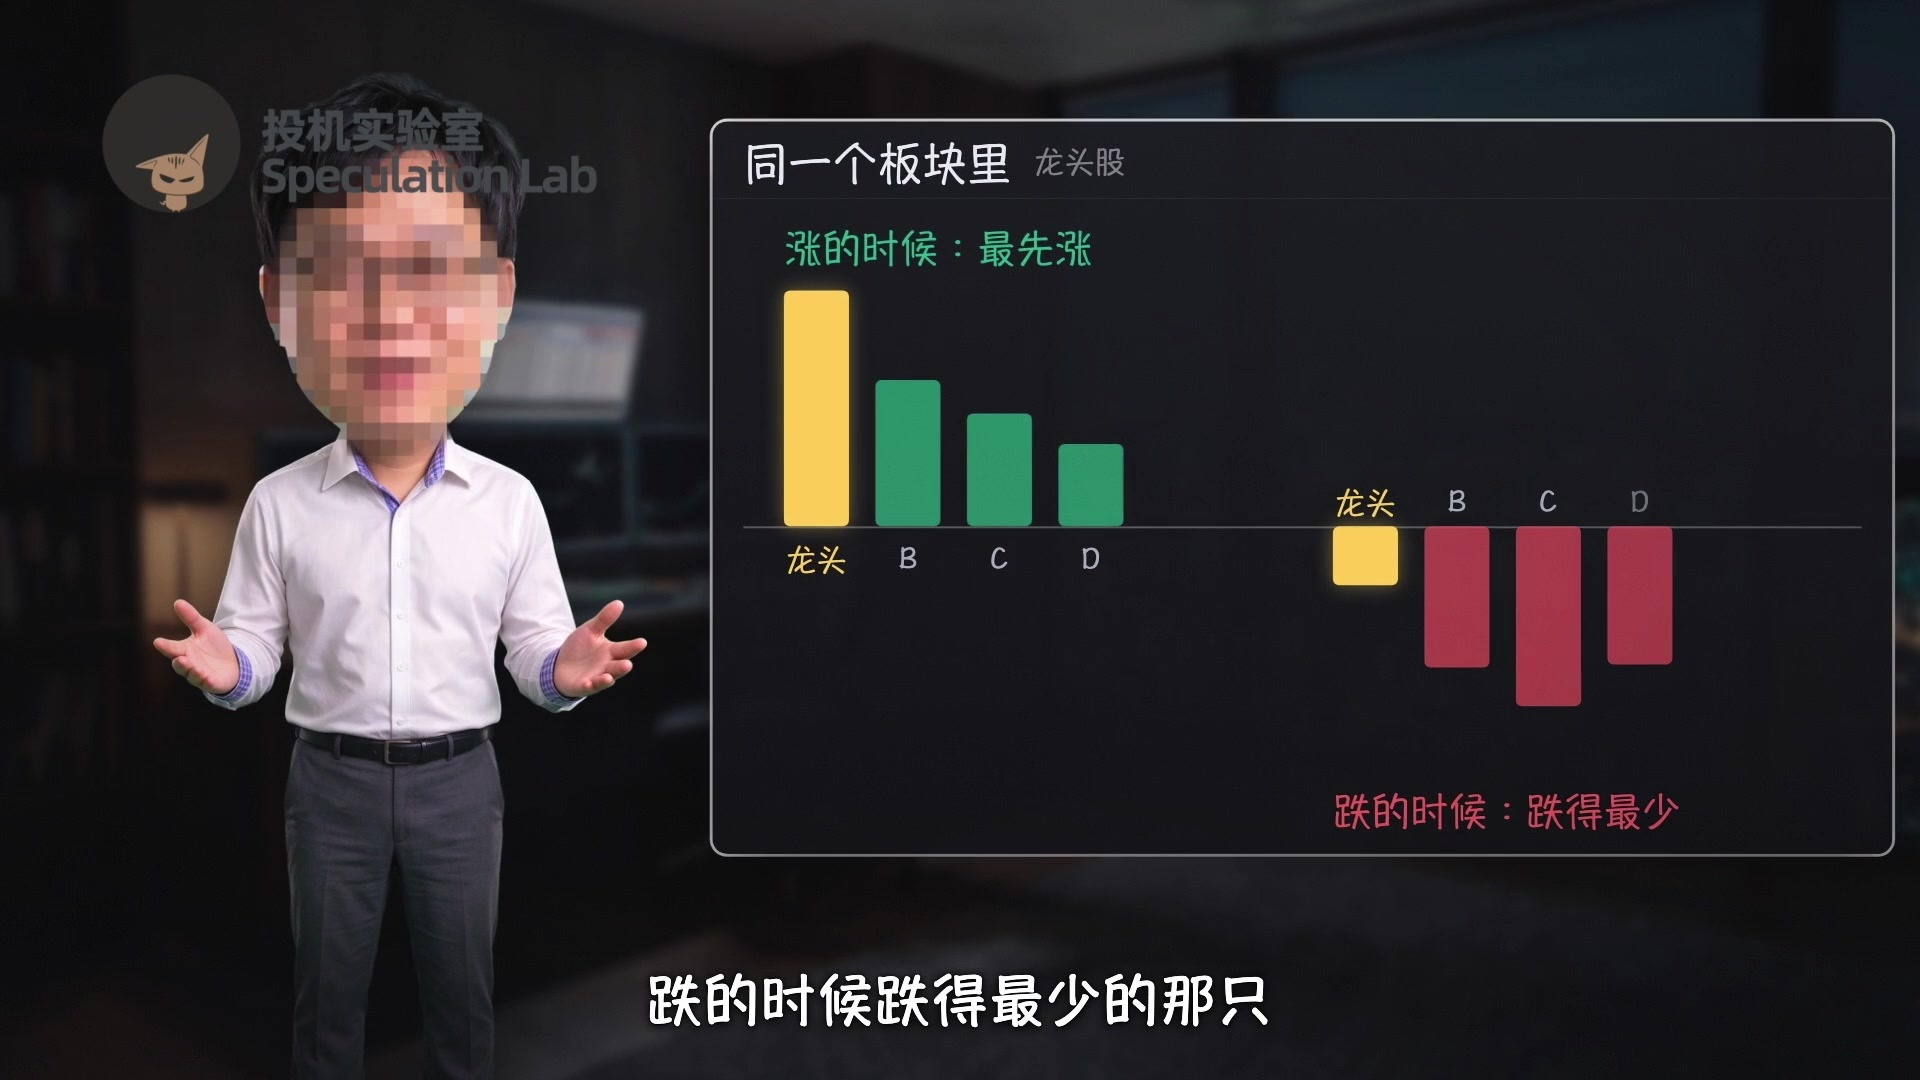
The best stocks are market leaders—the ones in a sector that rise first when the sector goes up and fall the least when it goes down.
From that group, he picks stocks that have reached new highs—that is, whose share price has hit its highest level in a given period, such as a one-year high. He adds them to his watchlist but doesn’t buy right away.
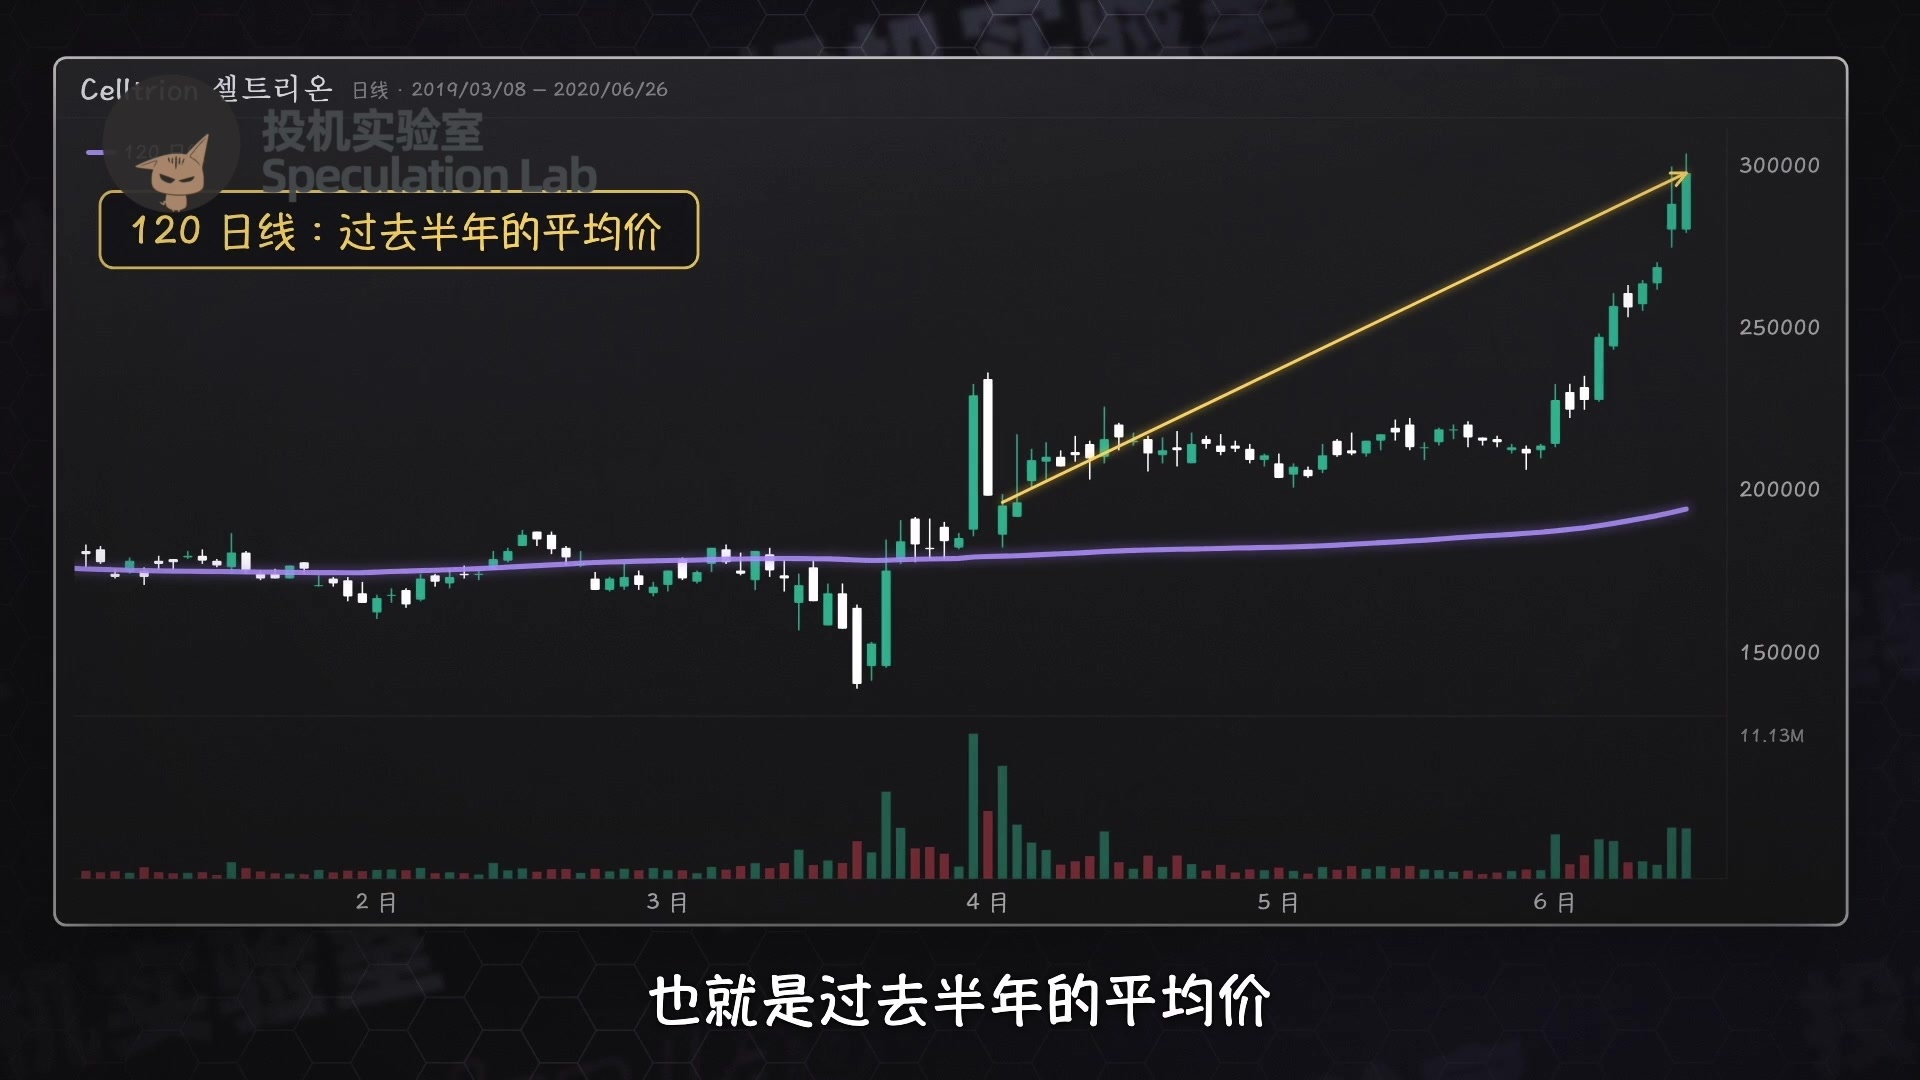
The trend also needs to be upward. For the share price to keep climbing, it first needs to be above the 120-day moving average, which represents the average price over the past six months. Don’t try to guess where a falling stock will bottom out.
There are some stocks to be cautious about. Don’t chase stocks that shoot up after an announcement. When news breaks, retail investors rush in all at once, and it’s easy to buy at the top.
Every March, South Korean companies submit their audit reports. Avoid companies whose reports haven’t come out yet, because an unfavorable audit opinion can lead to an immediate trading suspension, leaving you unable to sell.
Before buying at the close, also check whether a large number of new shares will be listed the next day—for example, from convertible bonds being converted into shares, a new share offering, or a stock dividend. If there are, people who receive the new shares may sell as soon as the market opens, which can easily drive the price down.

Now, the entry point. He waits for a bearish candle during an uptrend—that is, a bearish candle that forms while the share price is rising. A doji, where the opening and closing prices are about the same, also counts.
This bearish candle can appear either before or after the price breaks above the previous high. If it appears afterward, the odds of the price continuing to rise are even better. But a bearish candle alone isn’t enough; three conditions must be met before buying.
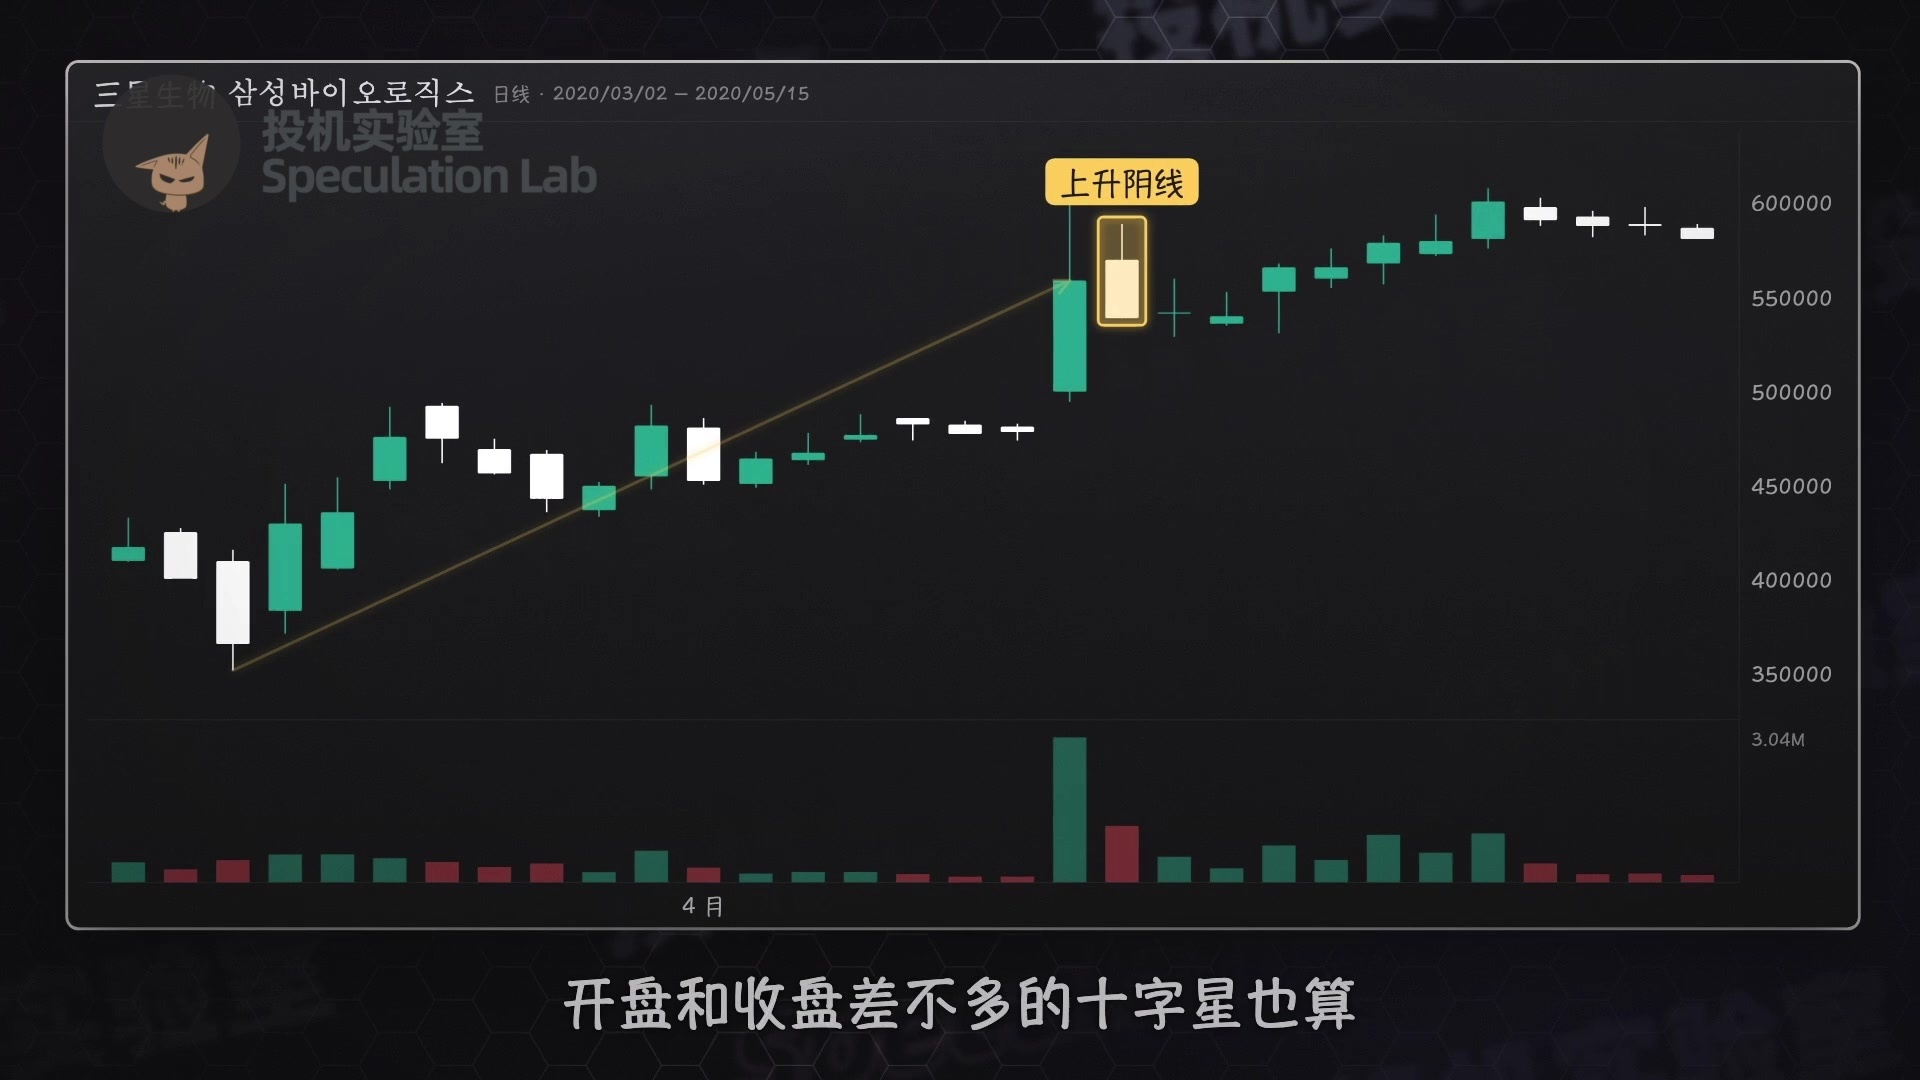
First, the move upward needs to be strong. Be cautious if the price inches up sluggishly. His benchmark is trading value above 50 billion won, or more than 30 million U.S. dollars. Stocks that surge on that kind of trading value are more likely to make a big move afterward.
He once gave the example of a stock called KPS. Trading value exceeded 50 billion won, and the stock broke above its one-year high. He bought a large amount when it pulled back after rising. The next morning, buyers poured in and the share price surged.
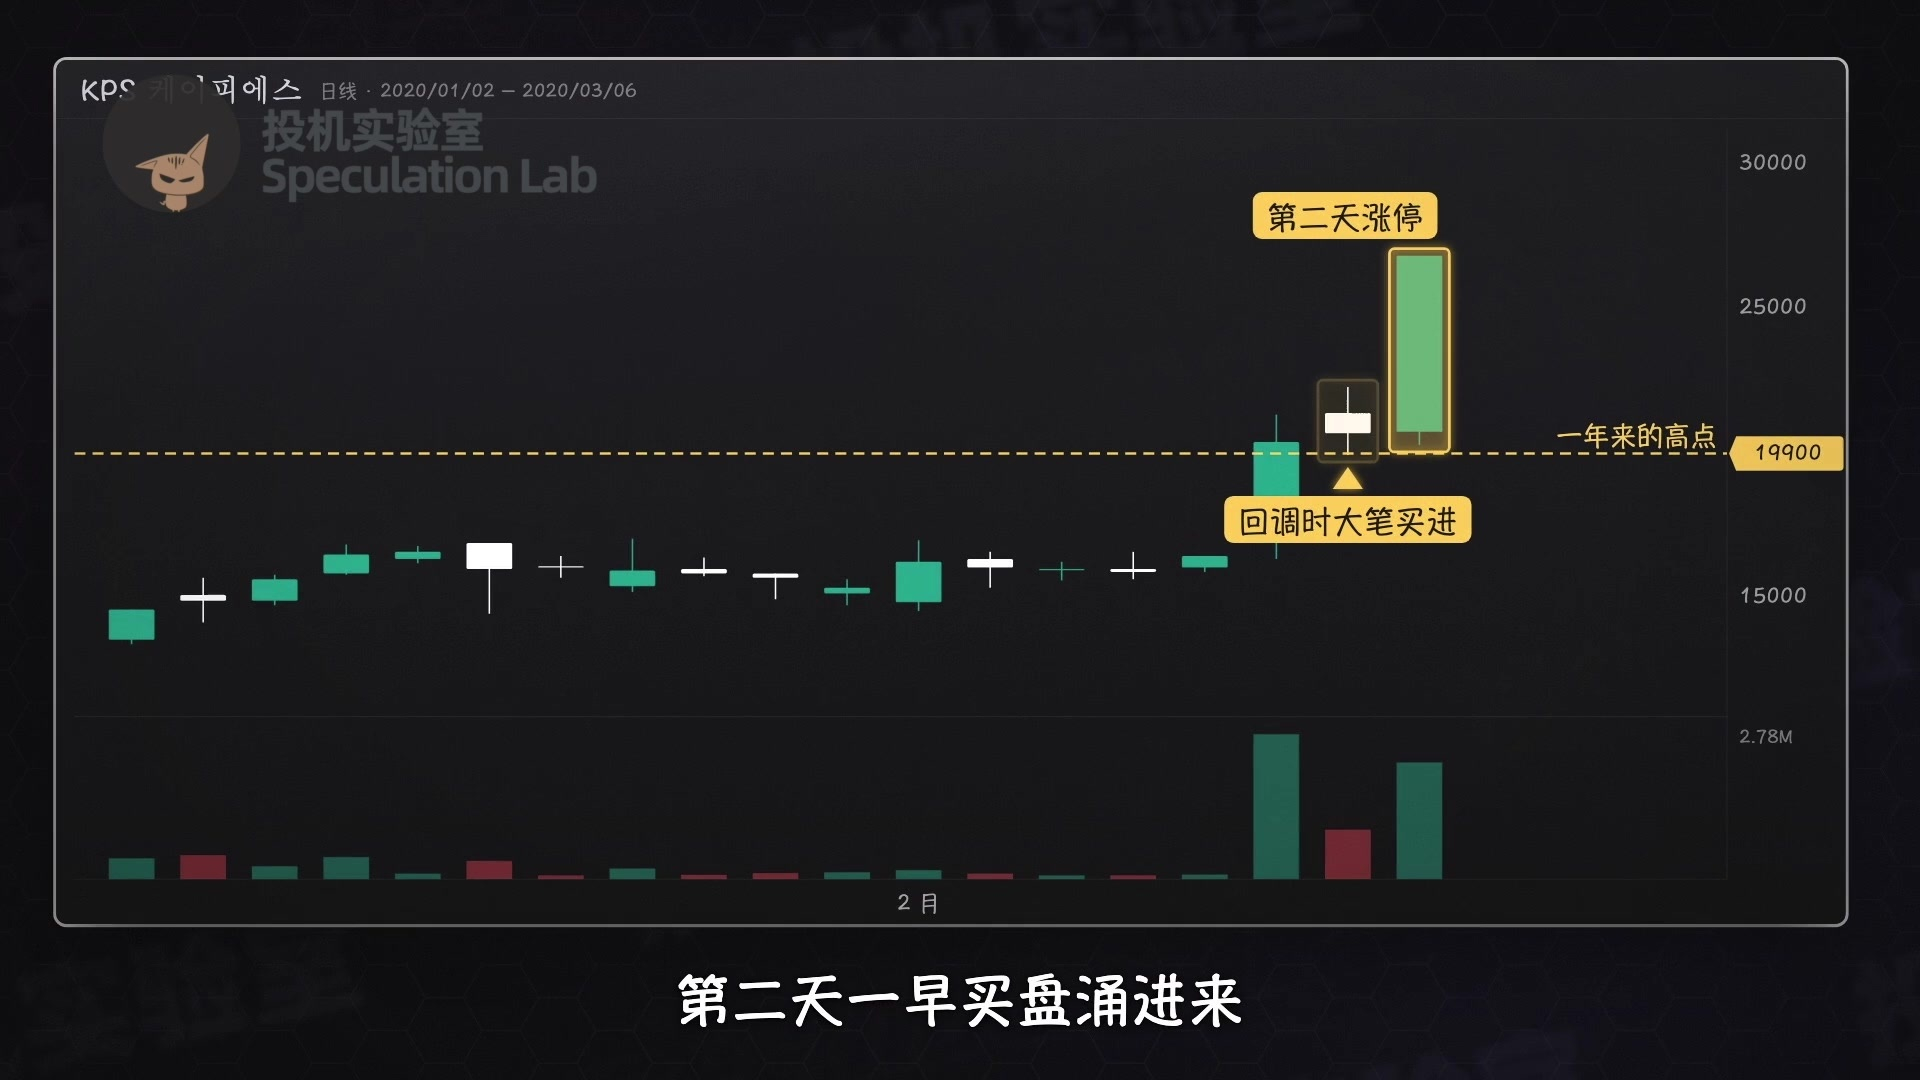
Second, the bearish candle must close above the five-day moving average, which is the average price over the past five days. Closing above it is safer.
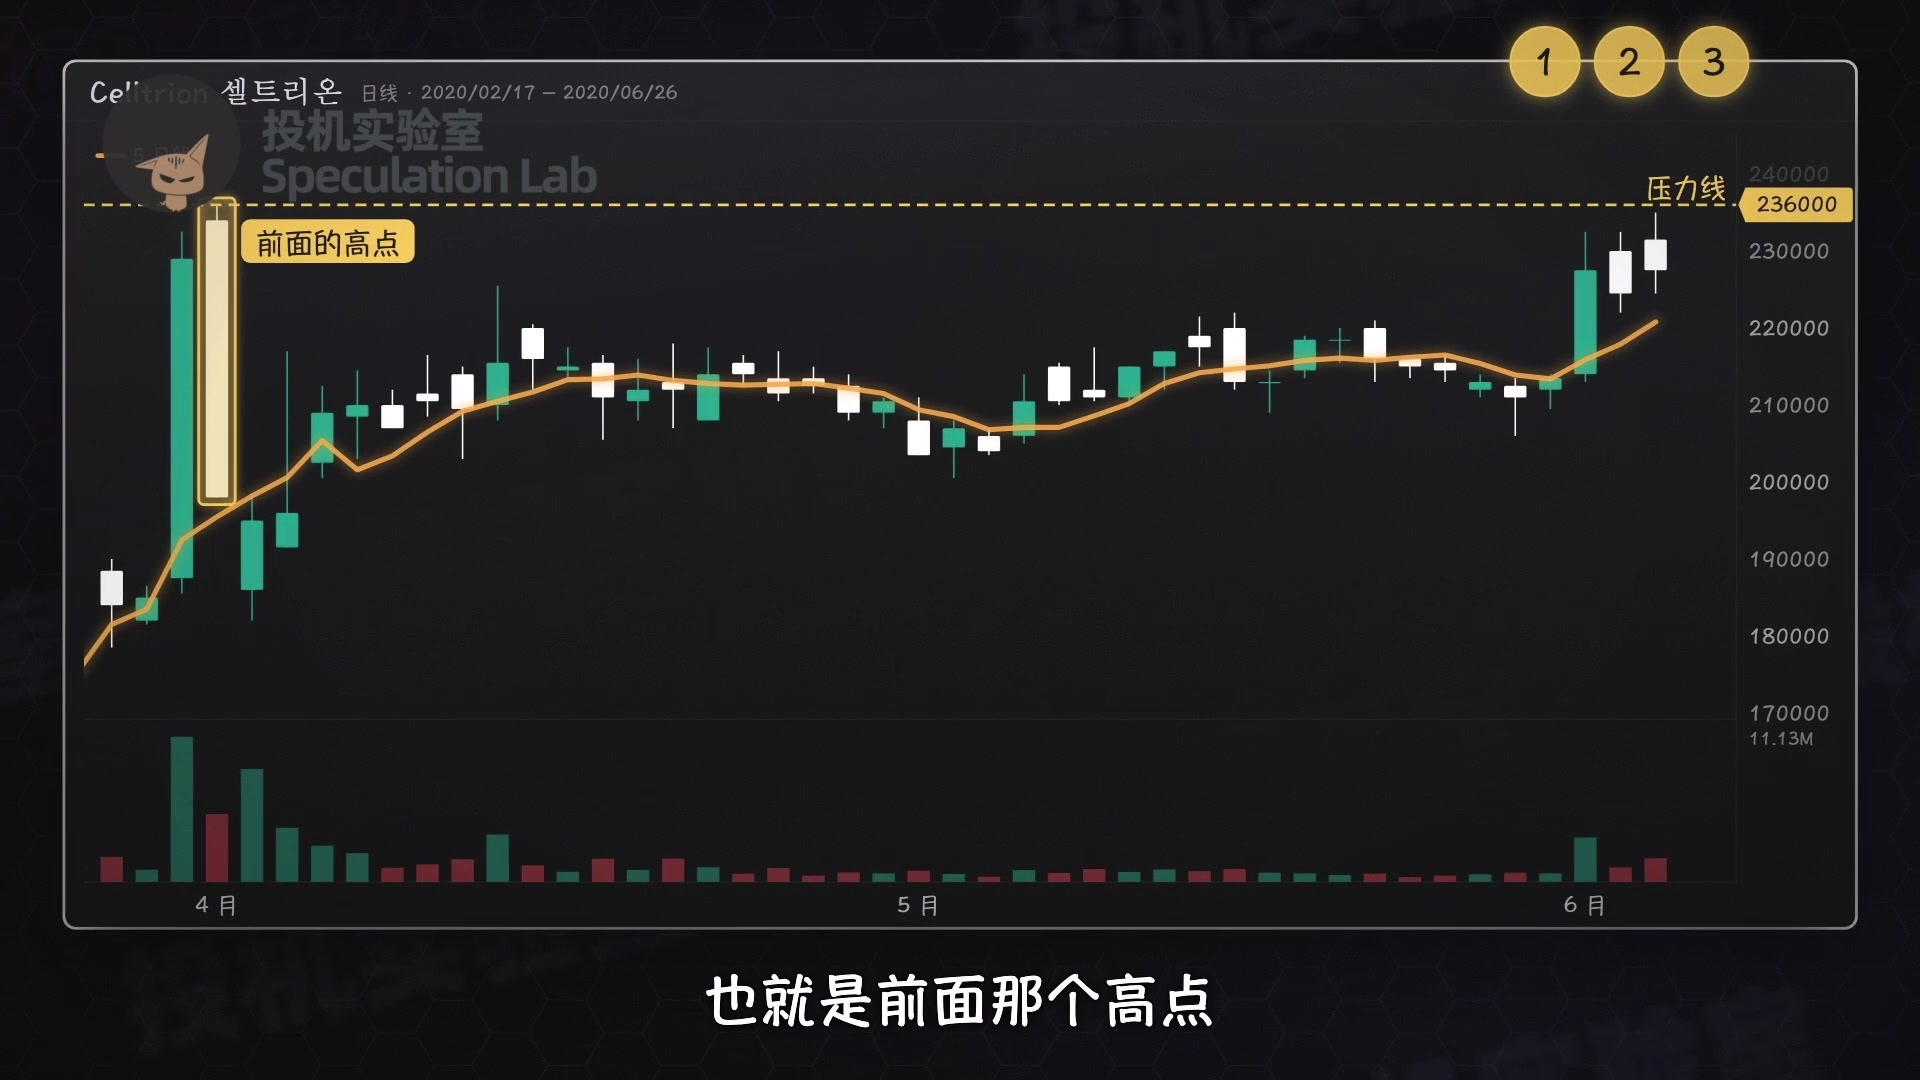
Third, draw the resistance line at the previous high, so you can see whether the price has broken through it. Then check whether institutions and foreign investors are buying that day.
Of the two, institutional activity matters more, because institutions like to buy a stock in large amounts over a short period. Once they’ve bought at a certain price, they’re unlikely to sell at that price right away. Korean trading apps show estimates of institutional and foreign investor buying and selling activity during the trading day.
If all three conditions are met, buy before the close, because you have to wait until near the end of the day to see how the stock closes. If a stock on your watchlist rises before an entry point appears, don’t chase it.
Decide before placing an order how much to buy, as a percentage of your total capital. If you buy at the close, you’ll have to hold overnight, so factor in how much you could lose if the stock opens lower the next day and you end up stuck holding it for another day at worst.
At any one time, focus on just two or three stocks. Until you’ve got the hang of it, keep your positions small, take fewer risks, and build up experience.

Finally, when to sell.
If you get this entry right, the stock will probably rise the next day. So if it still hasn’t risen after trading for a while from the open, cut your losses immediately. Decide the latest time you’ll get out before you buy.
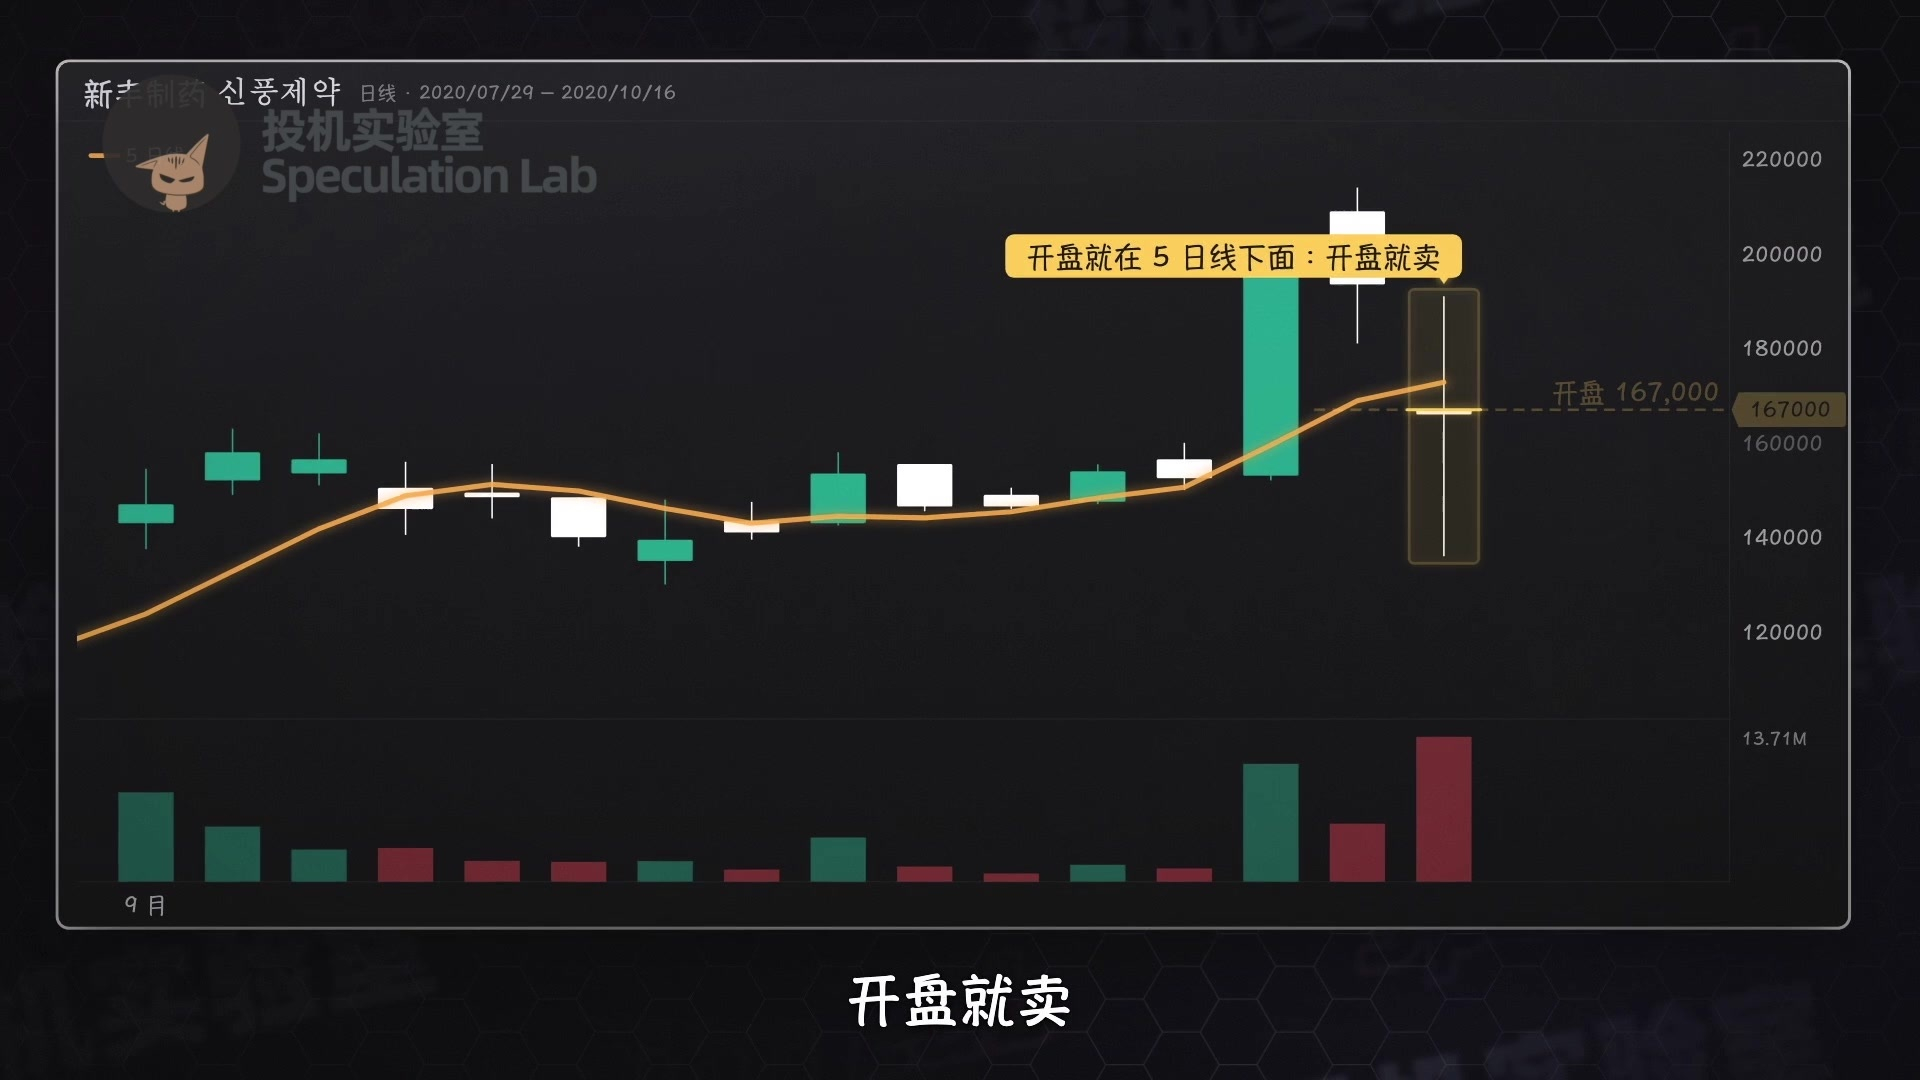
Hold on to stocks that are rising, and sell when they fall below the five-day moving average. If a stock opens below its five-day moving average, sell at the open.
There’s another situation where you should sell: when a stock has already risen to a very high level and its trading volume suddenly jumps to more than five times the volume on the up days.
For example, if it traded one million shares a day while rising, then suddenly trades more than five million shares in a day at a high price, take that as a confirmed peak. Even if it rises after you sell, don’t look back.

He also has a few rules for when to stop trading. For example, if things aren’t going well in the morning, take the afternoon off. If you do trade, only buy before the close.
If you make a mistake, like placing the wrong order or blindly following others into a stock, stop trading for the day. Trying to make your money back that same day will only lead to more mistakes.
If your emotions are unsettled, take a week off. Step back and watch from the sidelines; you’ll actually see things more clearly.
If the market is falling day after day, avoid holding positions overnight. Only hold overnight when the market is genuinely trending upward. And never borrow money to trade stocks—always keep some cash on hand, so you have money to buy when the right opportunity comes along.

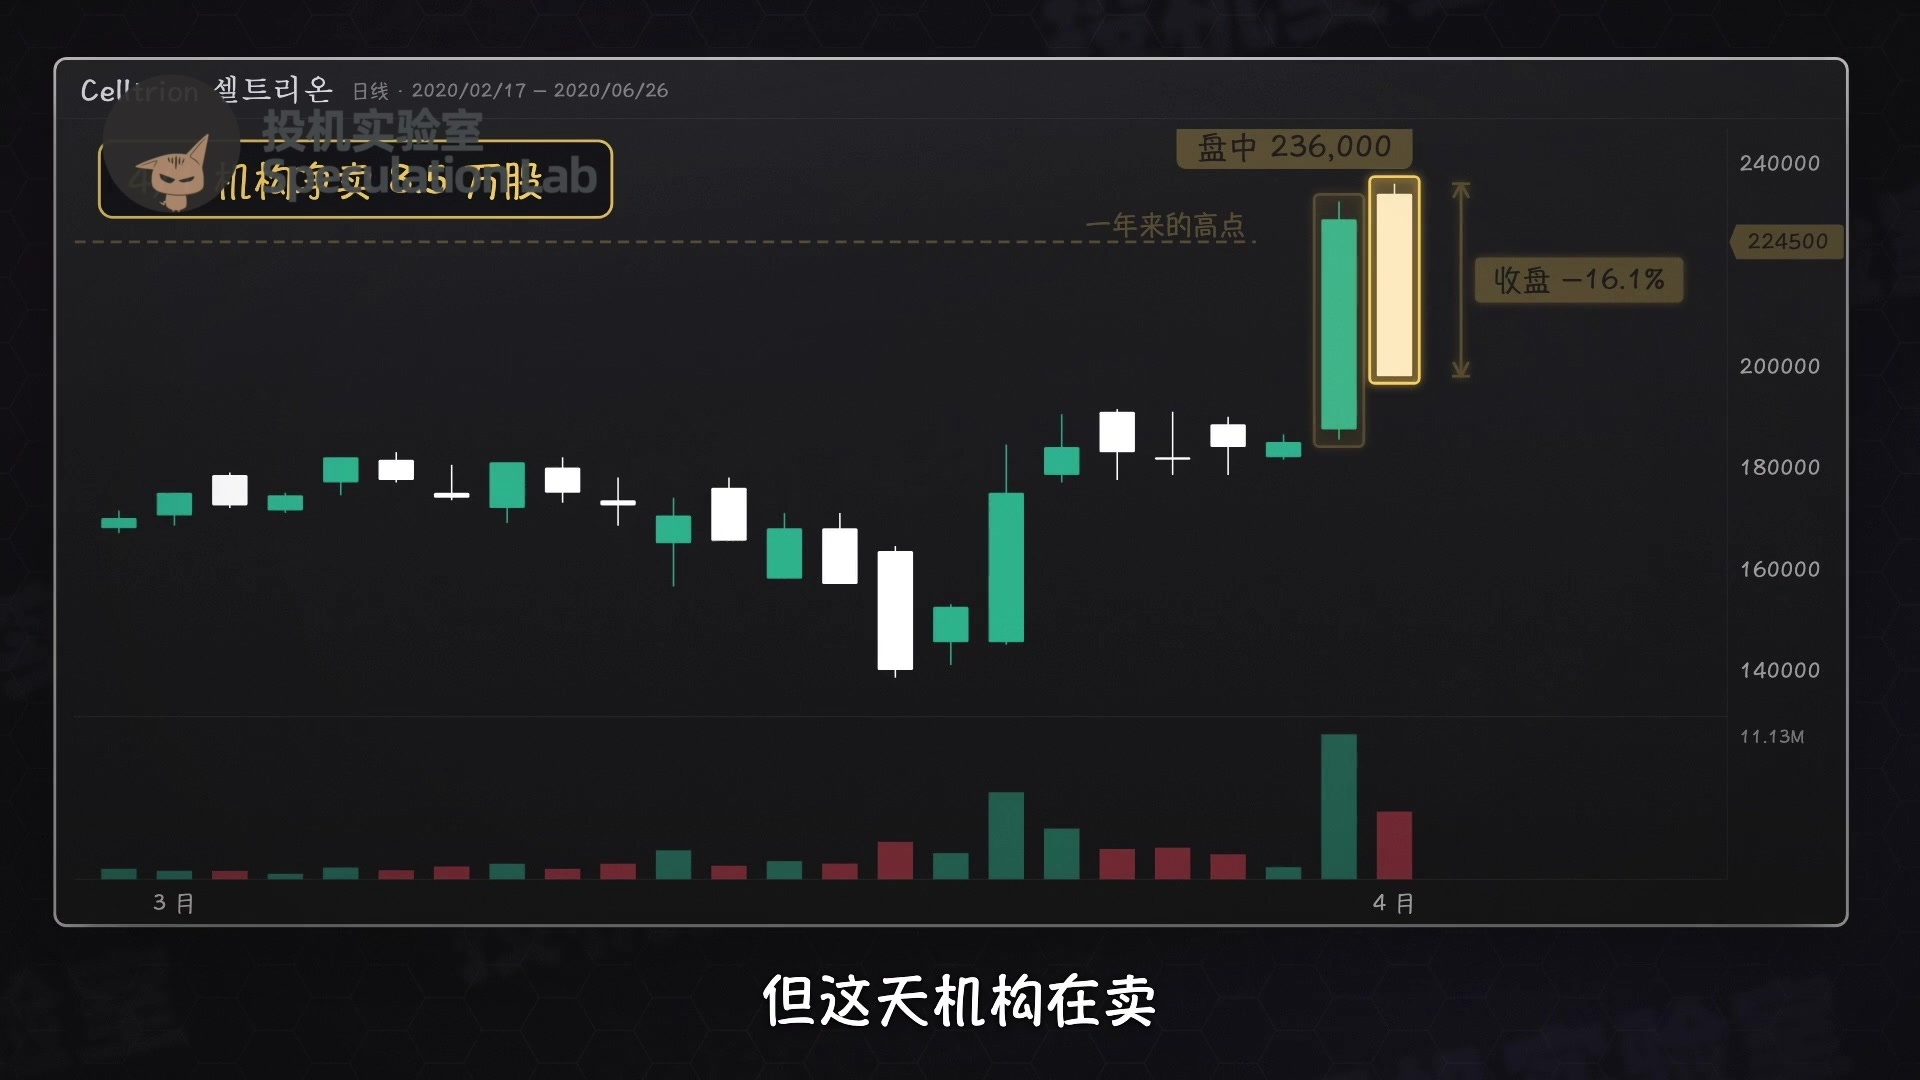
Let’s look at the Korean pharmaceutical company Celltrion as an example. At the end of March, its share price jumped more than 20 percent in a day, reaching a more-than-one-year high. Add it to your watchlist, but don’t chase it.
The next day, it surged intraday to 236,000 won, but then plunged and closed with a long bearish candle. Institutions were selling that day, so you still shouldn’t buy. The share price didn’t break above that level over the next two months, making this previous high a resistance line.
In early June, a long bullish candle on heavy volume surged upward. Trading value was far above 50 billion won, and the closing price was just shy of the resistance line.
The next day, it closed with a bearish candle. But institutions and foreign investors were selling, so don’t buy. The day after that, it formed another bearish candle, closing at 227,500 won—still above the five-day and 120-day moving averages. Institutions were buying that day too. All three conditions were met, so you could buy before the close.
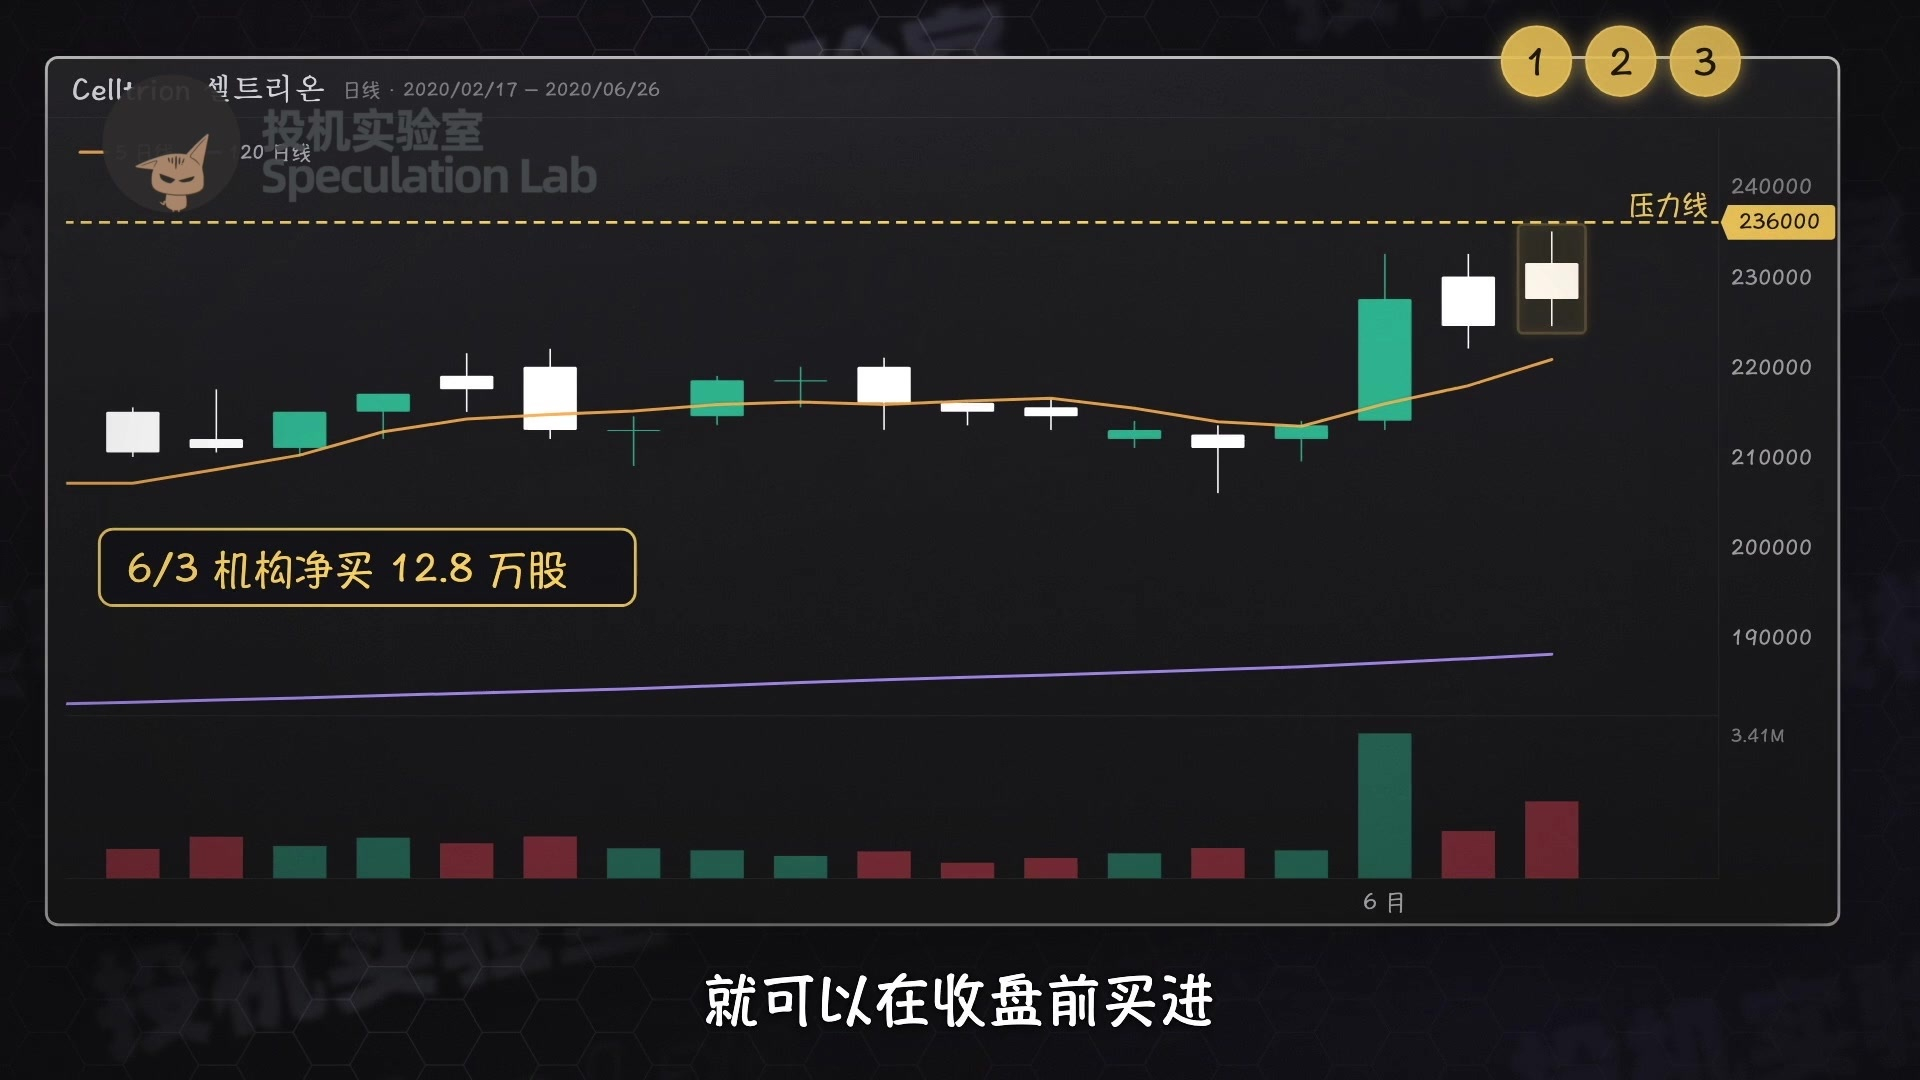
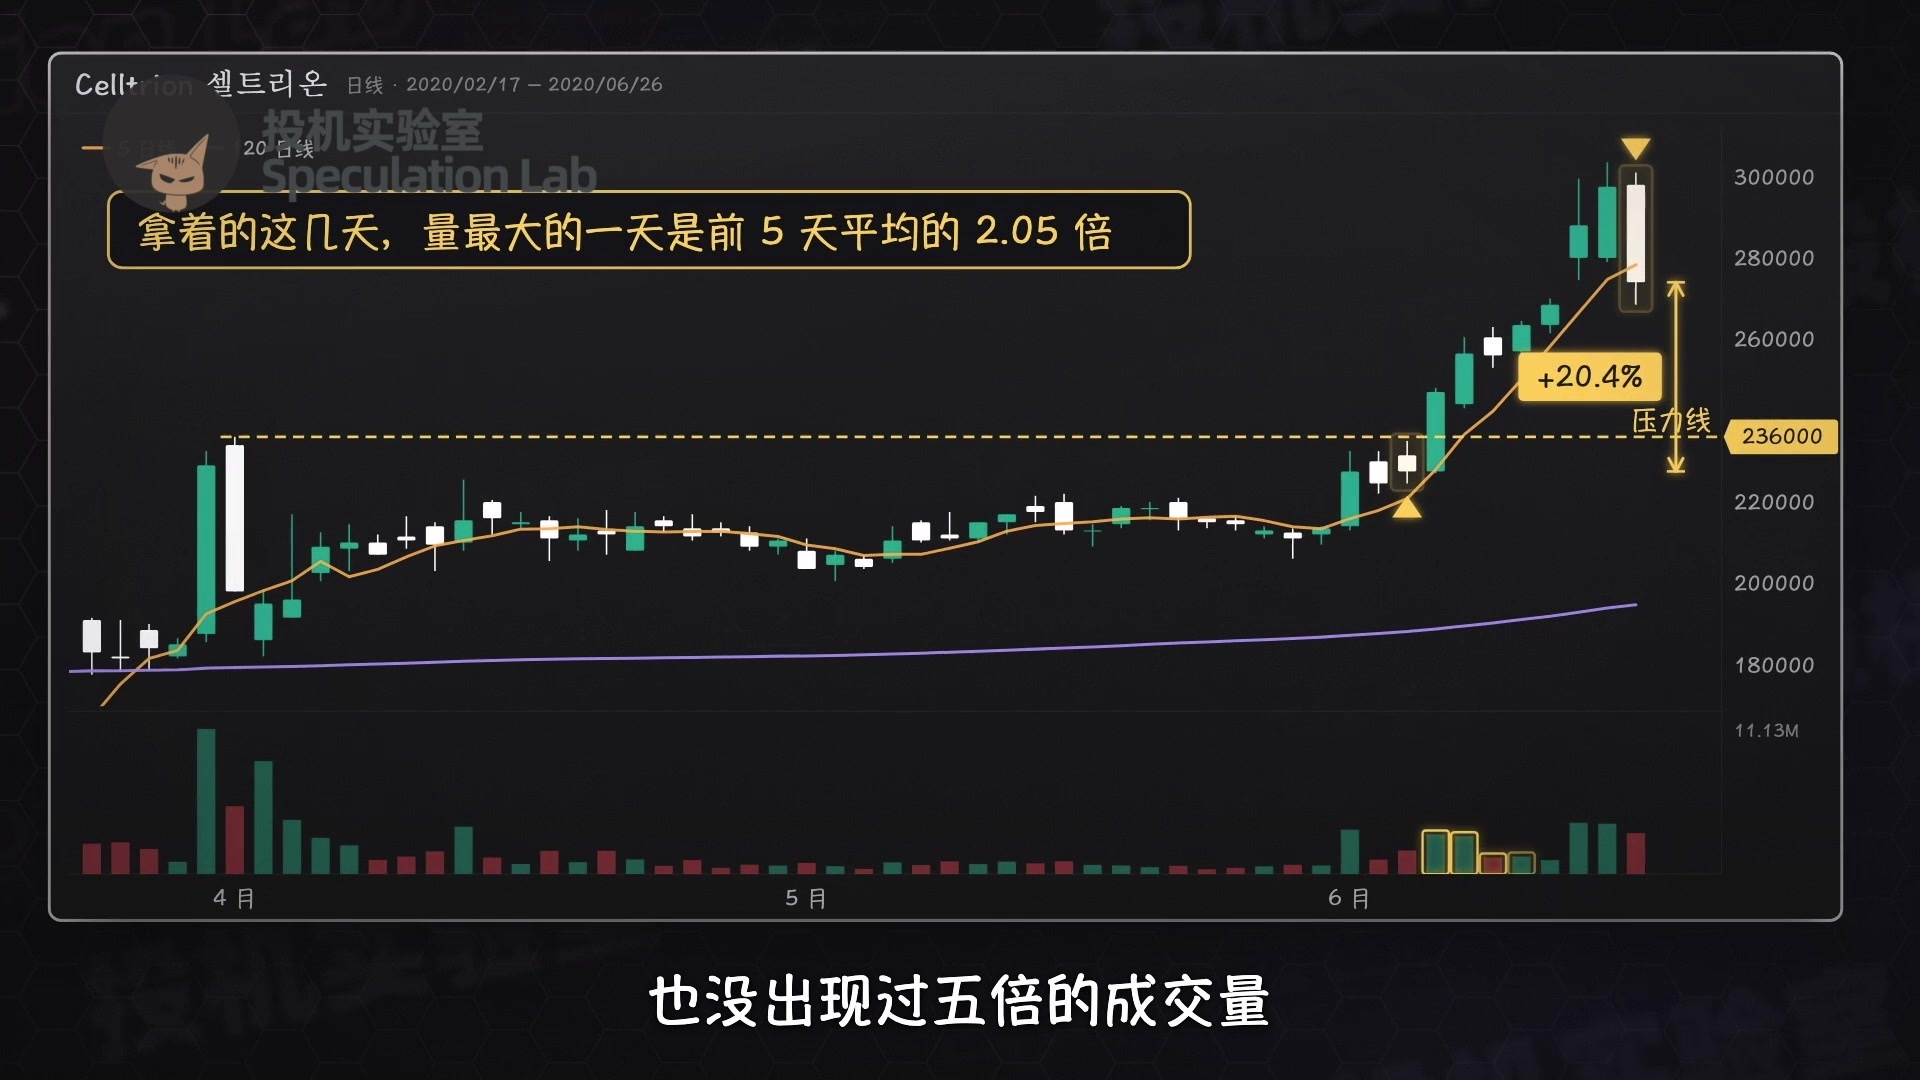
The next day, the stock didn’t fall after opening. A long bullish candle pushed straight through the resistance line, and the price then continued climbing along the five-day moving average.
It wasn’t until the eighth trading day after the purchase that it closed below the five-day moving average, at 274,000 won. That was the day to sell. The trade made more than 20 percent. During those holding days, trading volume never reached five times the usual level.
He made some adjustments for day trading—that is, buying and selling on the same day. He only trades from 9:00 to 10:30 in the morning, because the most people are buying and selling during the first hour and a half after the open, and prices move the most. Eight or nine tenths of his profits come from that period.
If you keep trading after that, it’s easy to start following others into stocks blindly. He limits any position carried over to the next day to a maximum of 10 percent of his account.

There are two types of entry points. One is when a leading stock has risen and then pulls back for two bearish candles. That’s a pullback entry, and the stock often rises again afterward, forming an N-shaped move.
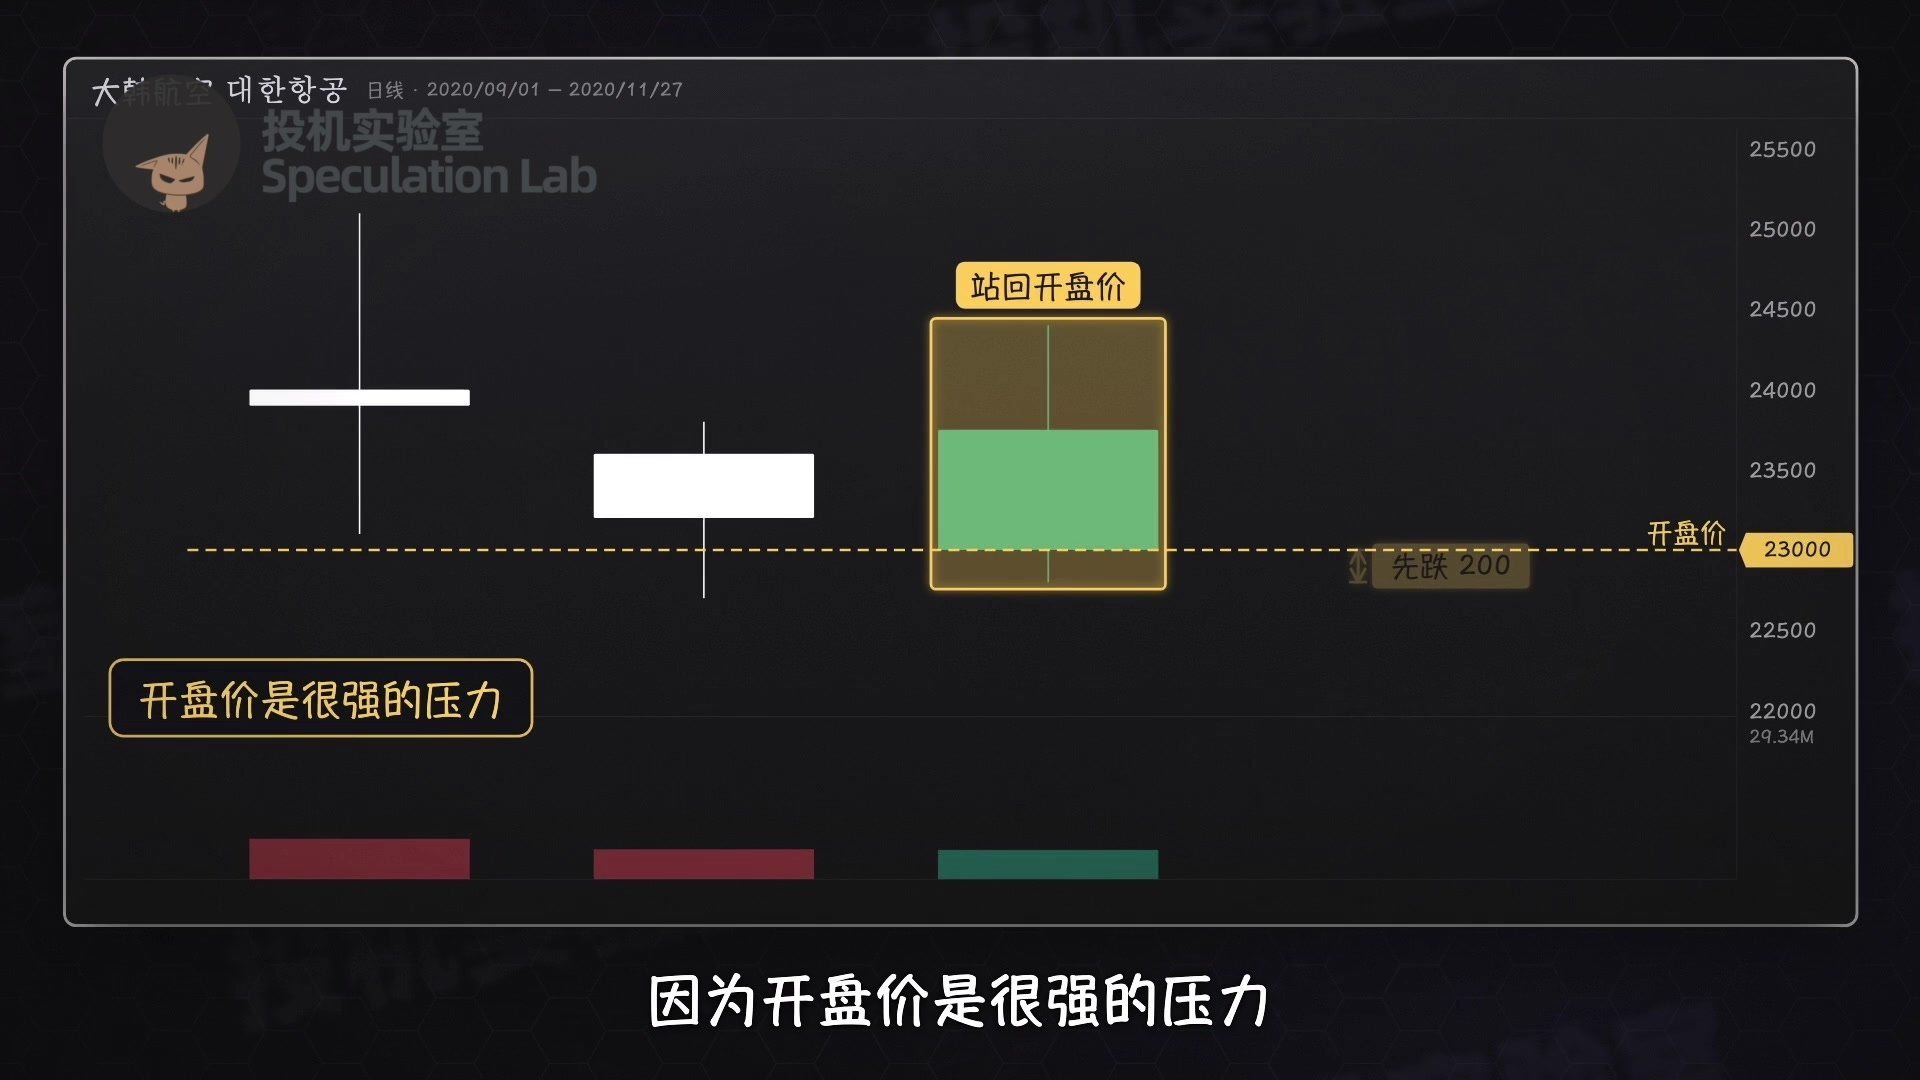
The other entry is when a stock falls after the open, then rebounds and gets back above its opening price. The opening price is a strong resistance level, so once the stock breaks through it, it can easily keep rising. Even if trading volume is high, he won’t buy if the chart pattern isn’t right.
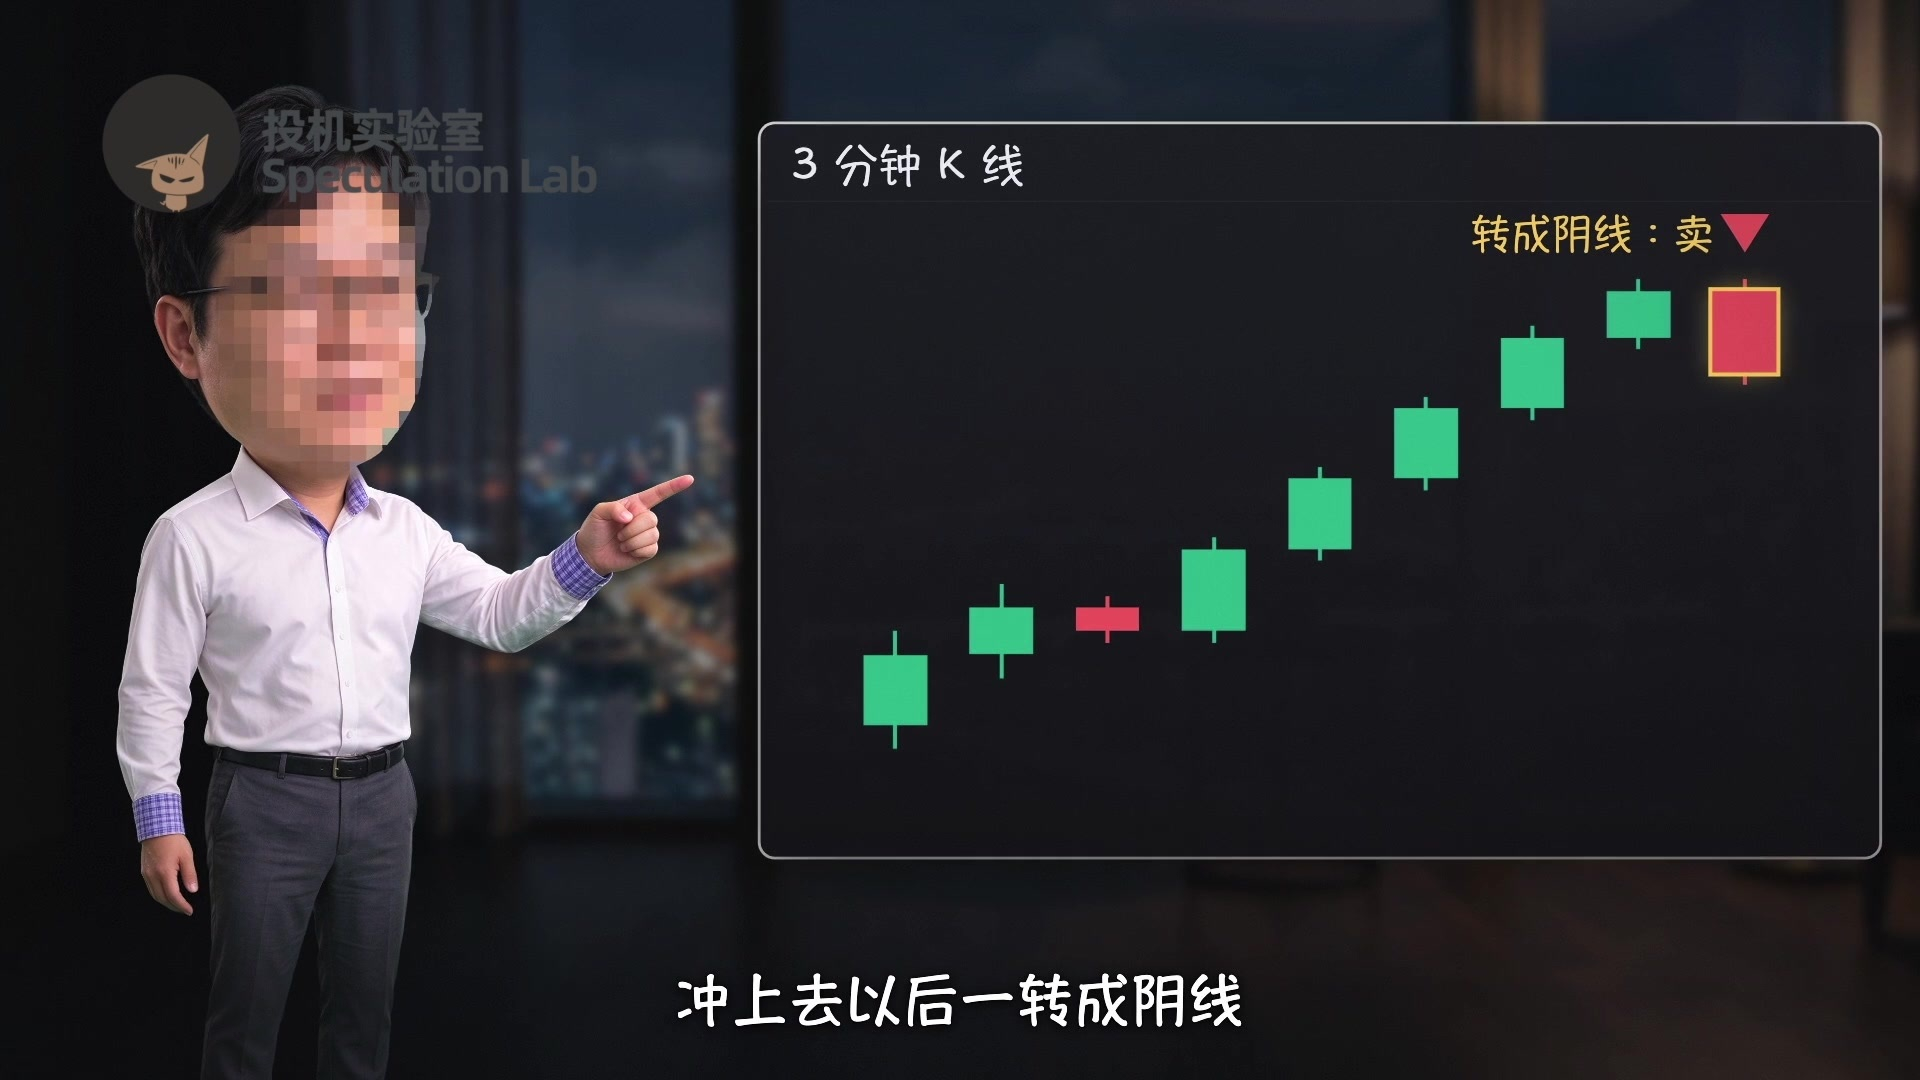
For an exit, watch the three-minute chart. Once the price surges and then turns into a bearish candle, you can sell.
Beginners should ideally set a firm stop-loss price in advance and sell if the stock falls to it. When he was starting out as a scalper, he mechanically cut his losses at 2 percent, because he didn’t yet have a feel for the market.
Here’s one of his day trades: Korean Air in November 2020.
That Monday, Korean Air announced it would acquire Asiana Airlines. Trading volume was 20 times normal, and the share price surged to a one-year high. After the announcement, the stock shot up, forming a bullish candle on the day it reached a new high. By his rules, you don’t chase it.
The next day, it formed a long bearish candle, followed by two more bearish candles. Volume fell to just one-tenth of what it had been on the announcement day. This is the pullback he talks about.
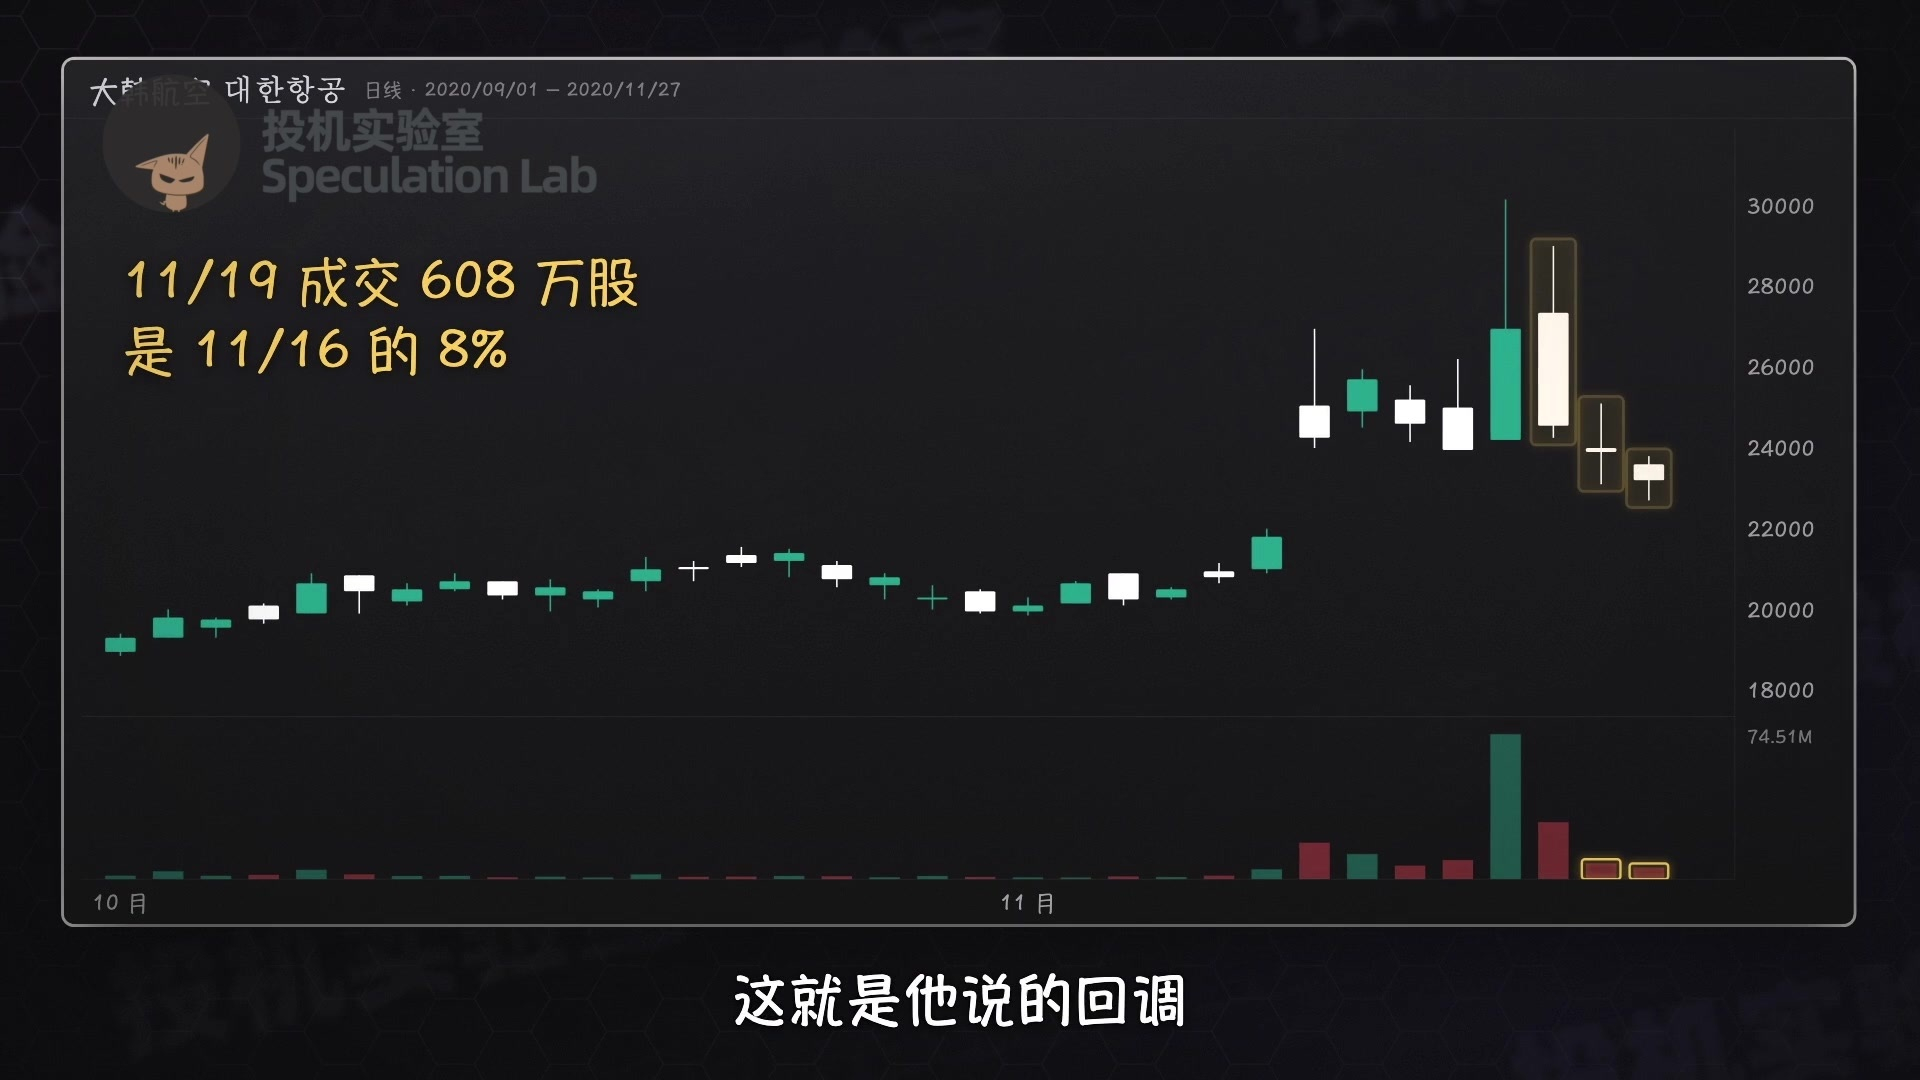
These bearish candles all closed below the five-day moving average, so he couldn’t buy using the new-high method. Instead, he made a day trade on the pullback.
On Friday, it opened at 23,000 won, slightly below the previous day’s price. Seeing buyers come in, he bought near the opening price.
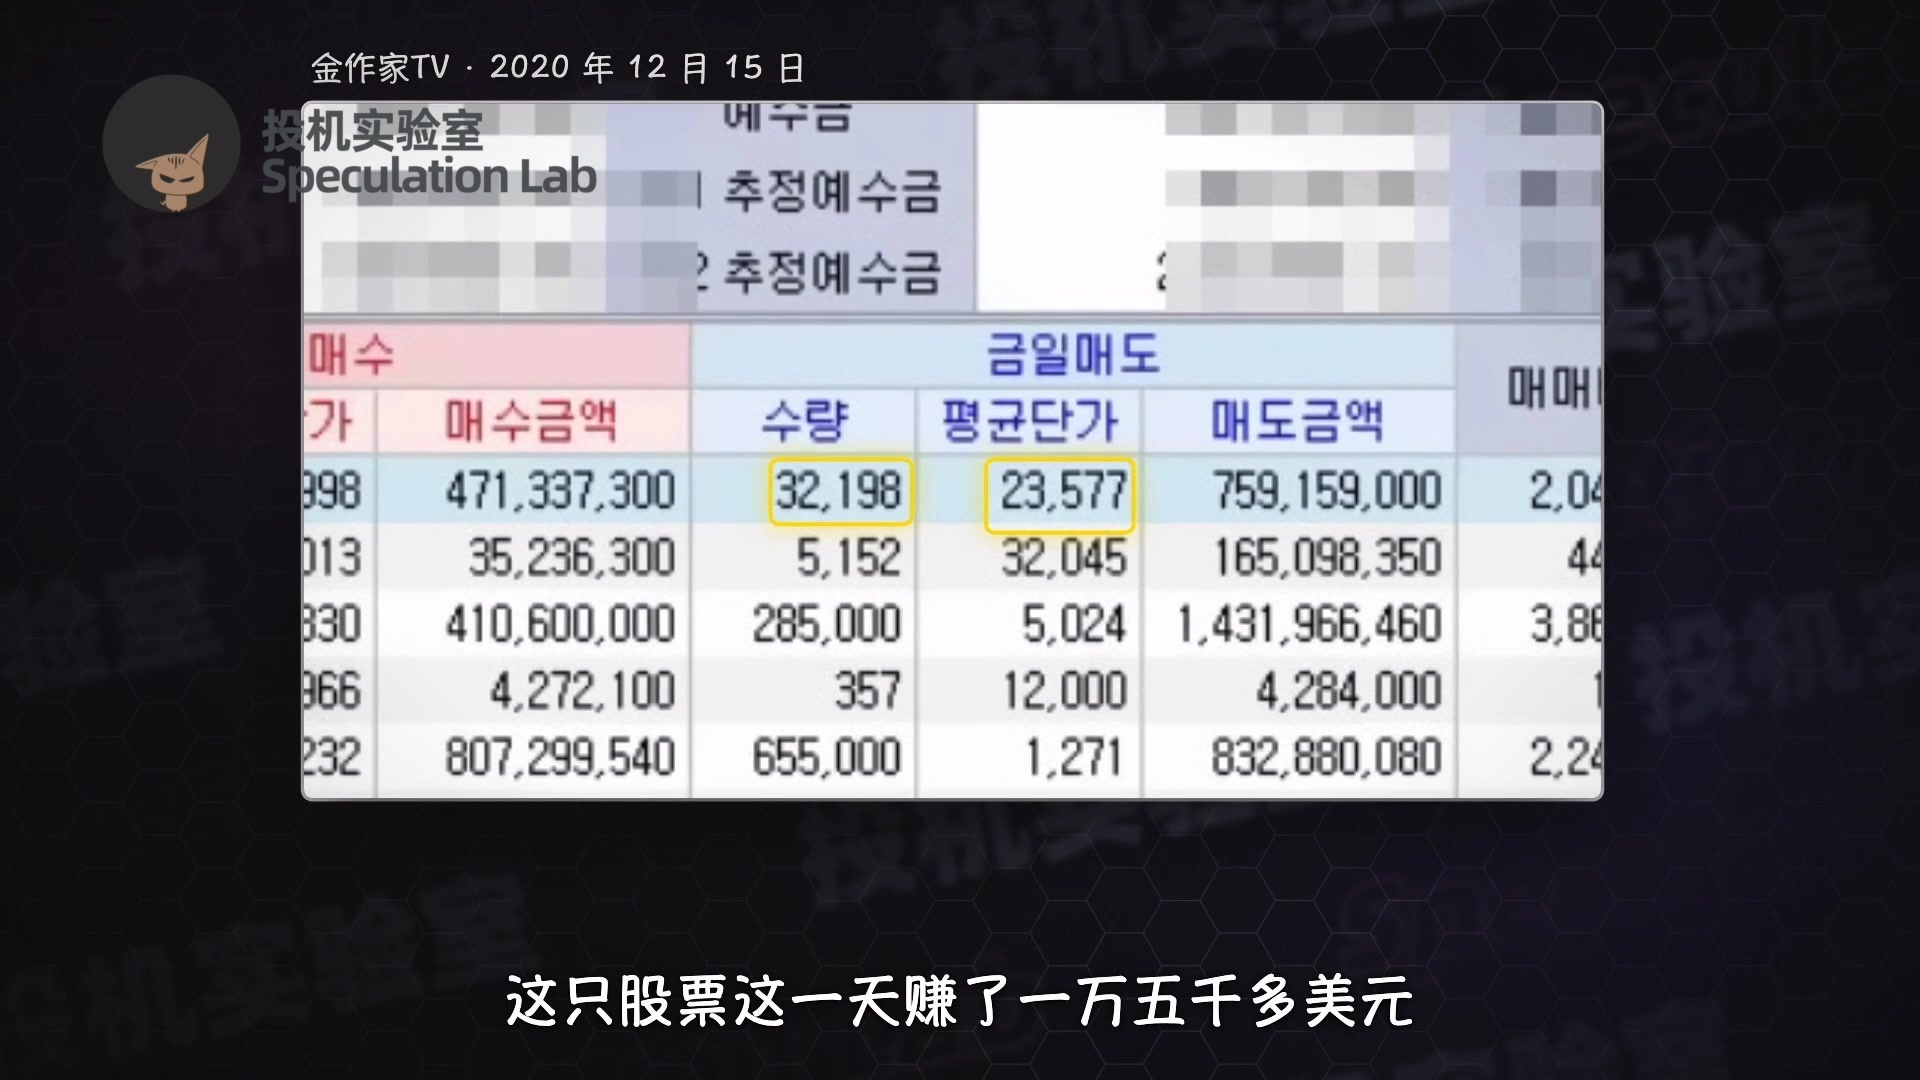
The stock reached a high of 24,400 won that day. He sold all his shares, including some he’d held over from the previous day, at an average price of just over 23,500 won. He made more than $15,000 on the stock that day.
All right, this is an entertainment program, not investment advice. Check that you’ve clicked the subscribe button. Good morning, good afternoon, good night, and bye!