172 at the peak: “buried alive” alert! $NVDA plunges $10—how can you survive the 160 lifeline?!
Never gamble your principal on the market makers’ conscience. Holding on at all costs isn’t perseverance—it’s handing them your head!
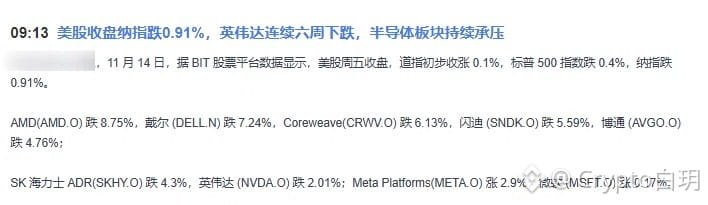
Look at the 1-hour chart: the MACD has made a bearish crossover, and the price has broken below the Bollinger Bands’ middle line! Even more alarming, the fund flow chart shows “strong outflows” across every period from 1D to 15D. The big players have already made their escape. U.S. semiconductor stocks have fallen for six straight weeks—don’t be blindly optimistic!
Trading strategy:
1. Defensive counterattack: The apparent stabilization above 160 is an illusion; 149.22 below is the abyss! Remember to “reduce your position on rebounds.” If it bounces, you must cut your position in half to reduce risk.
2. Trade the range: Sell high and buy low within the 160–165 range to lower your average cost. Don’t just stubbornly hold on and play dead.
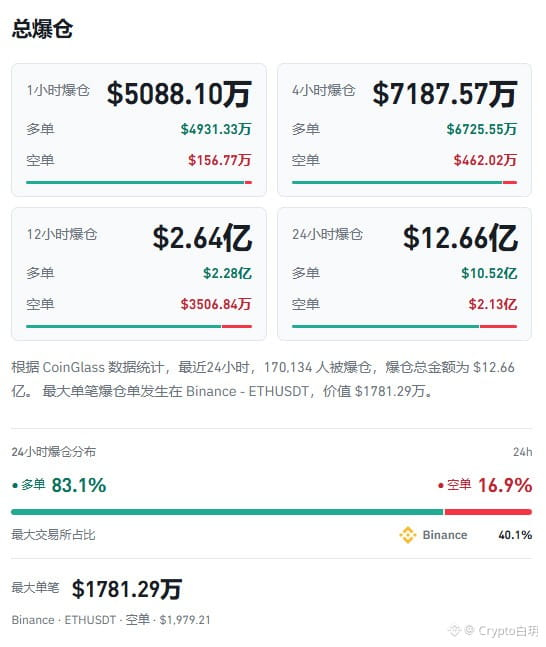
3. Get out if it breaks down: If it breaks below support on heavy volume, cut your losses immediately or open a short position to hedge. The liquidation chart shows more longs below are still lined up to get liquidated!
That’s the plan, but things can change rapidly during the trading session. Can you identify the precise entry and exit points yourself?
#美国PPI年率6.5%,低于预期或缓解BTC压力 #比特币Core披露Tor流量漏洞
Never gamble your principal on the market makers’ conscience. Holding on at all costs isn’t perseverance—it’s handing them your head!
Look at the 1-hour chart: the MACD has made a bearish crossover, and the price has broken below the Bollinger Bands’ middle line! Even more alarming, the fund flow chart shows “strong outflows” across every period from 1D to 15D. The big players have already made their escape. U.S. semiconductor stocks have fallen for six straight weeks—don’t be blindly optimistic!
Trading strategy:
1. Defensive counterattack: The apparent stabilization above 160 is an illusion; 149.22 below is the abyss! Remember to “reduce your position on rebounds.” If it bounces, you must cut your position in half to reduce risk.
2. Trade the range: Sell high and buy low within the 160–165 range to lower your average cost. Don’t just stubbornly hold on and play dead.
3. Get out if it breaks down: If it breaks below support on heavy volume, cut your losses immediately or open a short position to hedge. The liquidation chart shows more longs below are still lined up to get liquidated!
That’s the plan, but things can change rapidly during the trading session. Can you identify the precise entry and exit points yourself?
#美国PPI年率6.5%,低于预期或缓解BTC压力 #比特币Core披露Tor流量漏洞