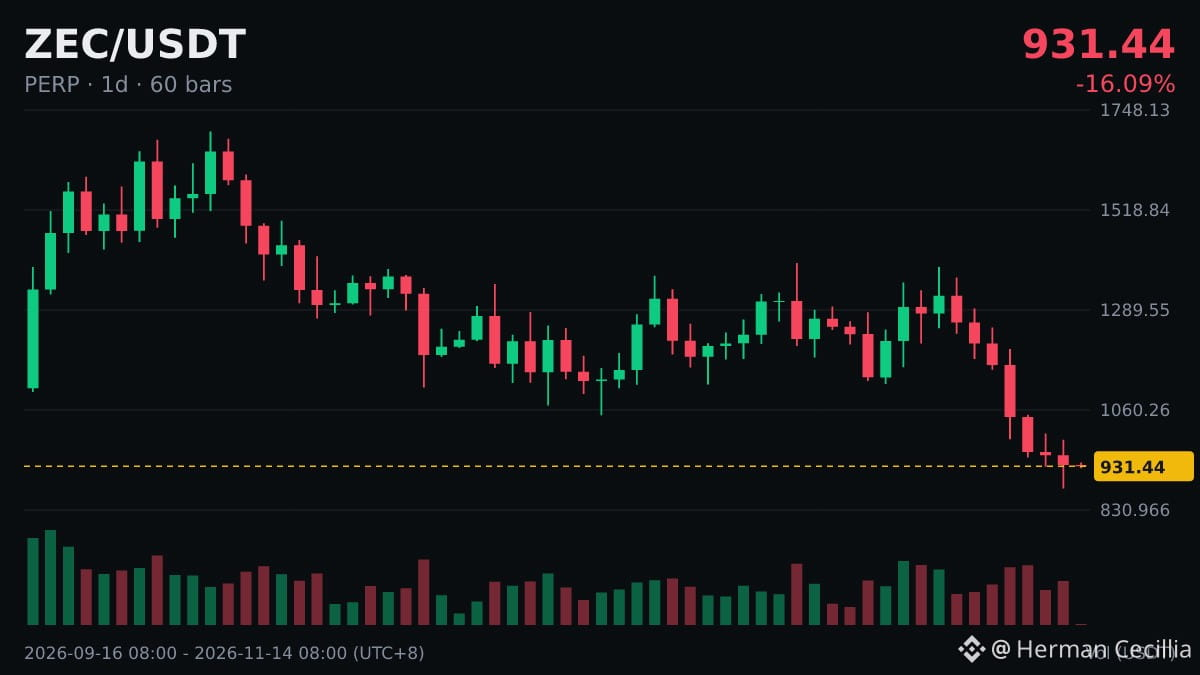
$ZEC daily line: 7 consecutive down days, down 29.37% in total over that period, and down 0.27% so far today.
A quick explainer: What do consecutive up or down days mean?
A consecutive up or down streak only records the colors of consecutive candlesticks; it doesn’t reflect how much each one rose or fell. A few small bullish candles and a few large bullish candles are completely different in significance.
After a series of candlesticks moving in the same direction, the price may already have moved some distance away from the short-term moving average, and a pullback toward the average is quite common.
Indicators can be wrong, but risk management should never be absent: deciding in advance what to do if your assessment is wrong is more important than guessing correctly.
A quick explainer: What do consecutive up or down days mean?
A consecutive up or down streak only records the colors of consecutive candlesticks; it doesn’t reflect how much each one rose or fell. A few small bullish candles and a few large bullish candles are completely different in significance.
After a series of candlesticks moving in the same direction, the price may already have moved some distance away from the short-term moving average, and a pullback toward the average is quite common.
Indicators can be wrong, but risk management should never be absent: deciding in advance what to do if your assessment is wrong is more important than guessing correctly.