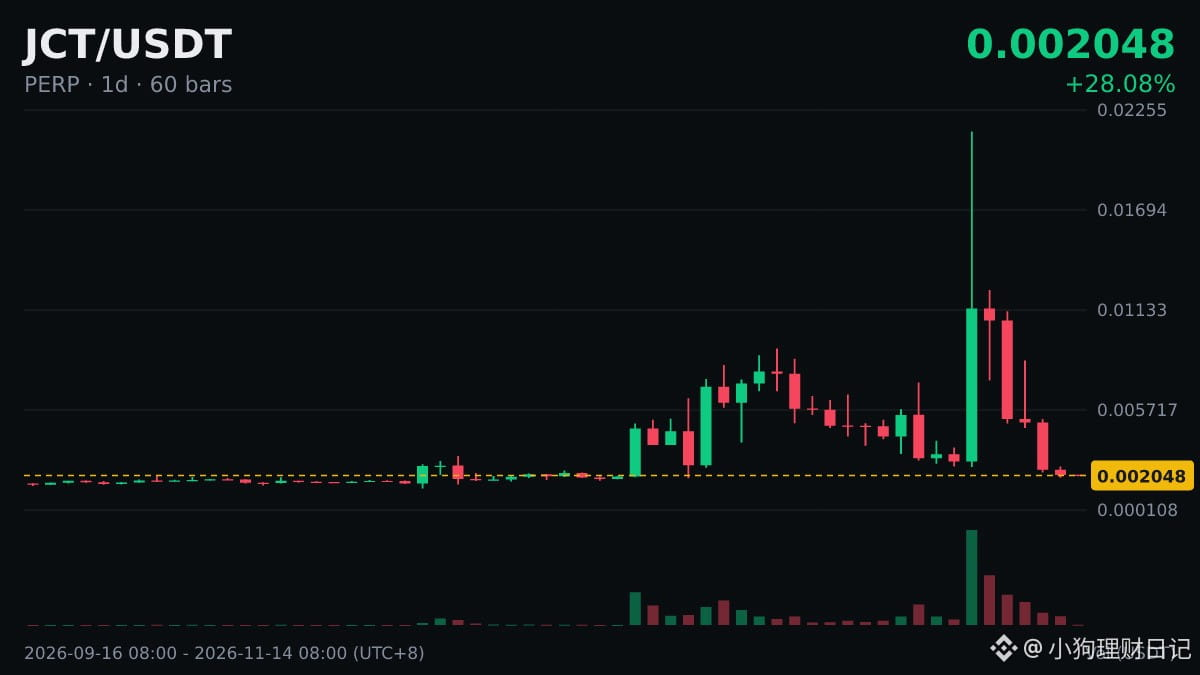
$JCT daily chart: 5 consecutive down days, with a cumulative change of -81.79%; today is down 1.44% so far.
Let’s use these figures to talk about consecutive up and down days.
The cumulative change is calculated from the opening price of the first candle in the streak to the closing price of the most recent one, so it says more about the strength of the move than the number of days does.
Consecutive up or down days are often seen as signs of a fairly consistent direction. But the longer the streak, the more winning positions and underwater positions tend to accumulate, usually increasing the pressure to give back gains.
The same reading can mean very different things in different market conditions, so don’t apply any rule of thumb mechanically.
Let’s use these figures to talk about consecutive up and down days.
The cumulative change is calculated from the opening price of the first candle in the streak to the closing price of the most recent one, so it says more about the strength of the move than the number of days does.
Consecutive up or down days are often seen as signs of a fairly consistent direction. But the longer the streak, the more winning positions and underwater positions tend to accumulate, usually increasing the pressure to give back gains.
The same reading can mean very different things in different market conditions, so don’t apply any rule of thumb mechanically.