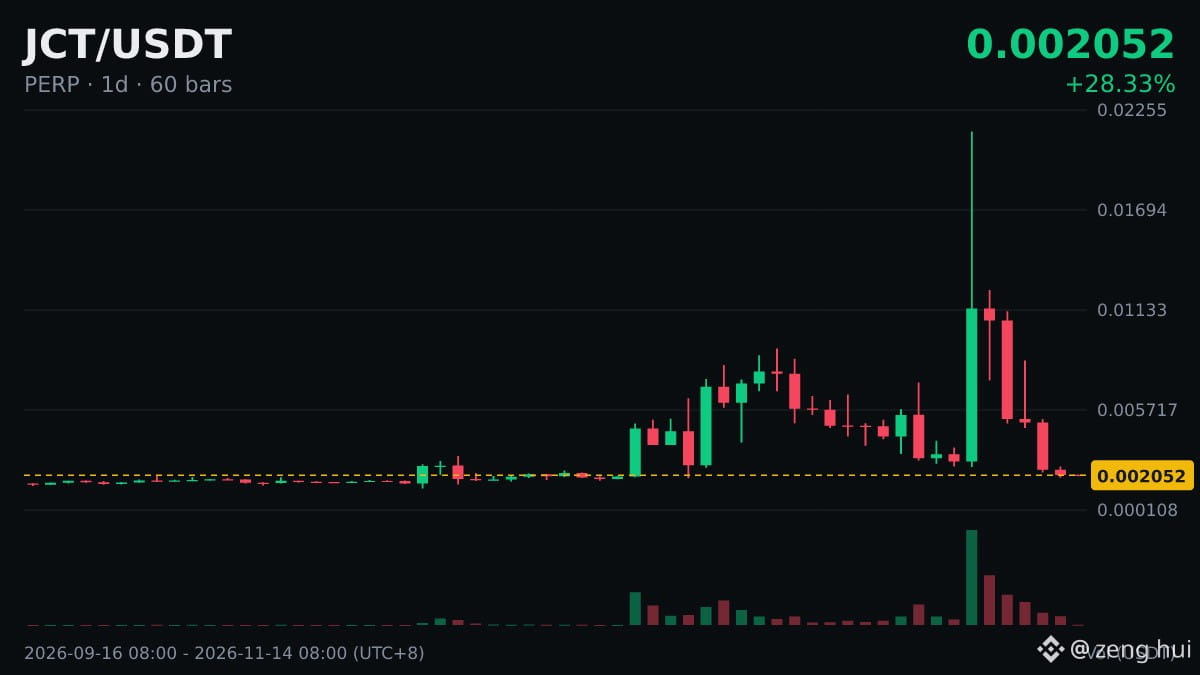
🐋 $JCT has had 5 consecutive bearish daily candles, with a cumulative decline of -81.79%; today it is down -1.25% so far.
Several consecutive days moving in the same direction indicate that one side has been dominant, but the longer the streak, the more important it is to watch for follow-through.
The cumulative change is measured from the opening price of the first candle in the streak to the closing price of the latest candle. It reflects the strength of the move better than the number of consecutive days.
Consecutive daily candles of the same color can also occur in a trading range: if several daily candles have small bodies and the same color, but the cumulative change is modest, the streak is of limited value as a signal.
Several data points confirming one another are more reliable than looking at just one, but even more signals cannot provide a definitive answer.
Several consecutive days moving in the same direction indicate that one side has been dominant, but the longer the streak, the more important it is to watch for follow-through.
The cumulative change is measured from the opening price of the first candle in the streak to the closing price of the latest candle. It reflects the strength of the move better than the number of consecutive days.
Consecutive daily candles of the same color can also occur in a trading range: if several daily candles have small bodies and the same color, but the cumulative change is modest, the streak is of limited value as a signal.
Several data points confirming one another are more reliable than looking at just one, but even more signals cannot provide a definitive answer.