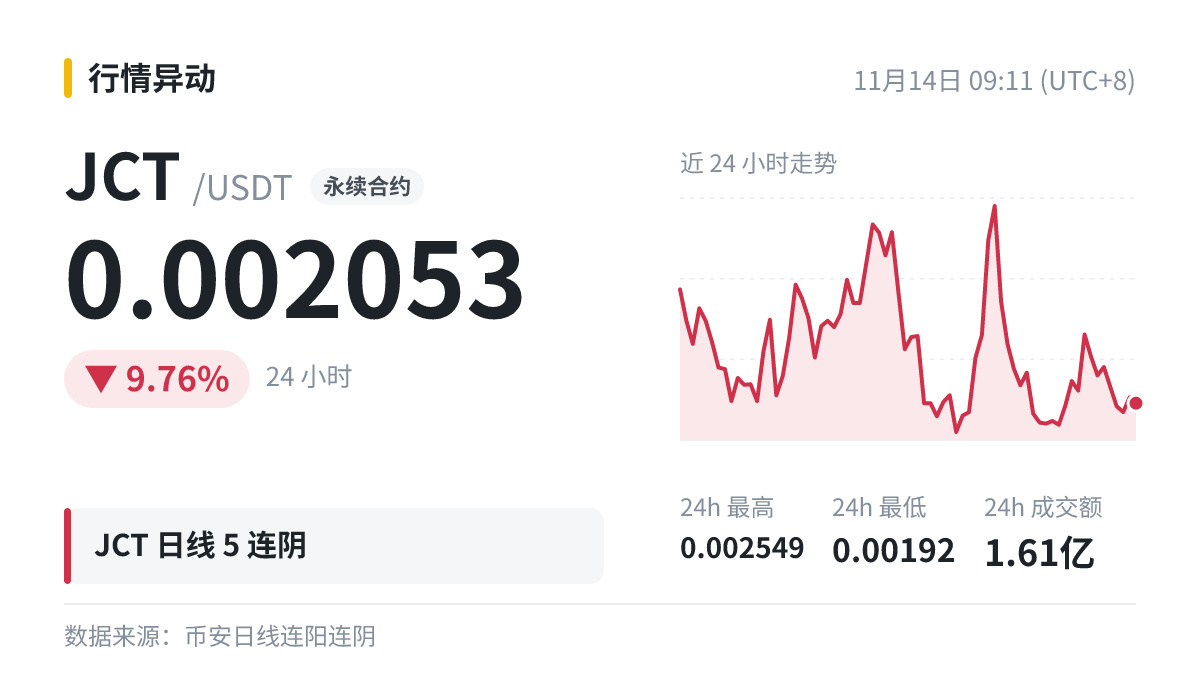
$JCT |5 consecutive down days on the daily chart|Cumulative: -81.79%
Before looking at your position, first understand consecutive up and down days.
The cumulative change over the period is measured from the opening price of the first candle in the streak to the closing price of the latest candle. It says more about the strength of the move than the number of days.
Many people also look at key price levels: when a streak approaches a previous high or low, or a round-number level, whether it breaks through is often the next thing to watch.
The point of understanding an indicator is to be less spooked by a single number—not to use it to predict tops and bottoms.
#JCT
This is not trading advice.
Before looking at your position, first understand consecutive up and down days.
The cumulative change over the period is measured from the opening price of the first candle in the streak to the closing price of the latest candle. It says more about the strength of the move than the number of days.
Many people also look at key price levels: when a streak approaches a previous high or low, or a round-number level, whether it breaks through is often the next thing to watch.
The point of understanding an indicator is to be less spooked by a single number—not to use it to predict tops and bottoms.
#JCT
This is not trading advice.