📊 $BTC and the red weekly streak: what does the data say?
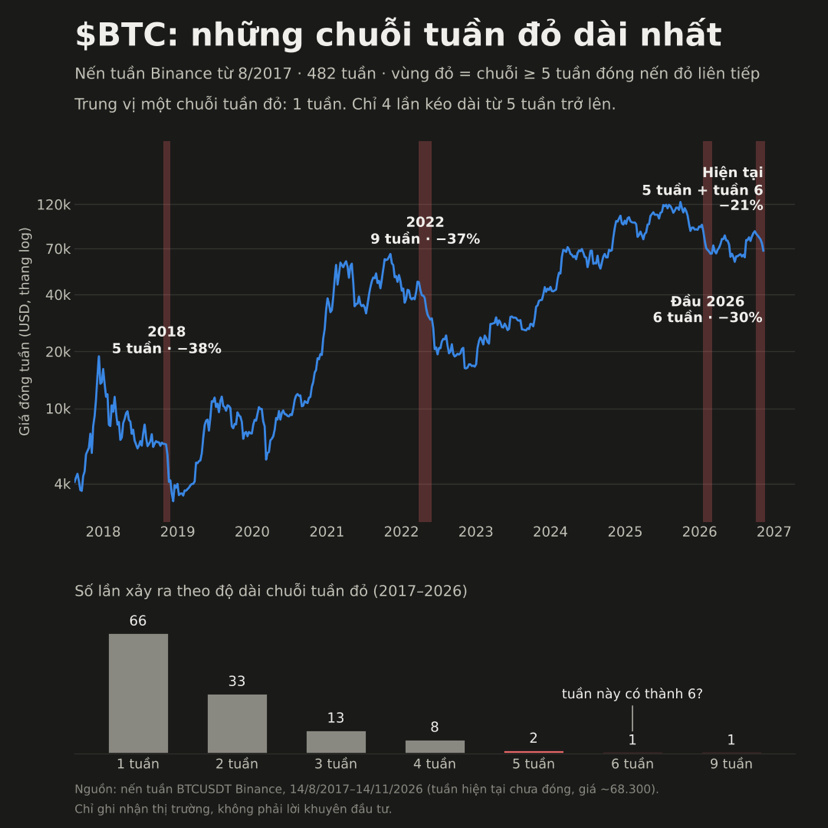
$BTC has closed red for 5 consecutive weeks. This week it is down −8.7% (~68,300). If it closes the week below 74,851 (7 a.m. Monday, Vietnam time), the streak will reach 6 weeks.
Binance data since 8/2017 (482 weeks):
→ The median red weekly streak is just 1 week
→ Only 4 streaks have lasted 5 weeks or more: 2018 (5), 2022 (9), early 2026 (6), and the current one
→ After streaks of 4 weeks or more: prices were higher 3 months later in 7 of 11 cases, but the bottom often wasn’t in right away
Context: The Fed is leaning toward rate hikes, ETFs are seeing outflows, and stablecoin supply is shrinking. October PPI came in below expectations, but $BTC only briefly rebounded to 70,188.
Levels the market is watching: 67,450 and the 200-week MA (~67,750).
💬 In your opinion, will BTC’s red weekly streak end in week 6?
For market information only, not investment advice.
#BTC #CryptoTrading #PPI
$BTC has closed red for 5 consecutive weeks. This week it is down −8.7% (~68,300). If it closes the week below 74,851 (7 a.m. Monday, Vietnam time), the streak will reach 6 weeks.
Binance data since 8/2017 (482 weeks):
→ The median red weekly streak is just 1 week
→ Only 4 streaks have lasted 5 weeks or more: 2018 (5), 2022 (9), early 2026 (6), and the current one
→ After streaks of 4 weeks or more: prices were higher 3 months later in 7 of 11 cases, but the bottom often wasn’t in right away
Context: The Fed is leaning toward rate hikes, ETFs are seeing outflows, and stablecoin supply is shrinking. October PPI came in below expectations, but $BTC only briefly rebounded to 70,188.
Levels the market is watching: 67,450 and the 200-week MA (~67,750).
💬 In your opinion, will BTC’s red weekly streak end in week 6?
For market information only, not investment advice.
#BTC #CryptoTrading #PPI