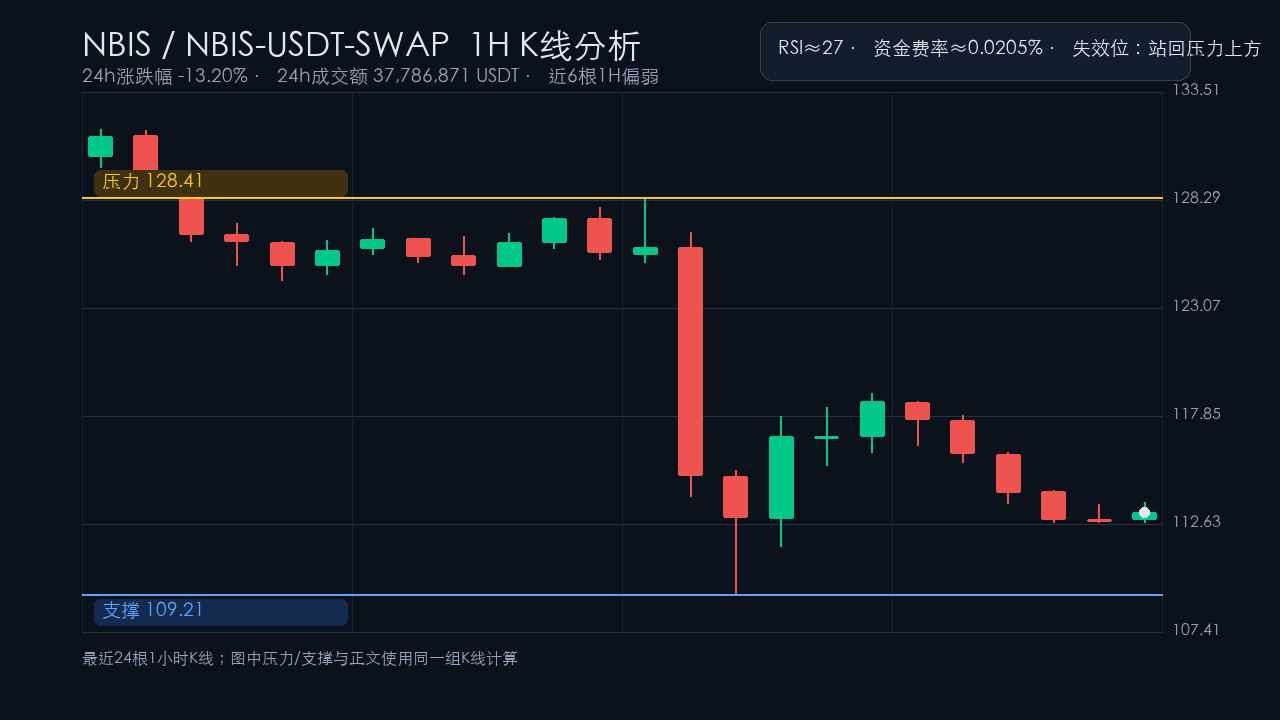

NBIS market activity has picked up, with 24-hour trading volume at approximately 37,786,871 USDT and a 24-hour change of about -13.20%. The 24-hour and most recent 1-hour trends are currently aligned, both leaning weak. The change across the last 6 hourly candlesticks is about -3.82%. In this kind of market, it’s more useful to watch key levels than to focus only on the percentage change.
On the 1-hour chart, the nearest resistance is at 128.41, with support at 109.21. The RSI is around 27, so a short-term oversold bounce is possible. The funding rate is about 0.0205%. If the price just moves back and forth between these two levels, it suggests the market is still repricing. Waiting for confirmation is steadier than chasing volatility.
Here’s what I’d watch in trading: if the rebound consistently fails to reclaim resistance, bears remain in control. If resistance is quickly reclaimed, that may indicate the downward momentum is fading. If the price breaks below support on rising volume, be alert for further weakness. If it moves back above resistance, the bearish thesis is invalidated.
My personal view: I care more about the quality of the rebound than whether the decline looks scary. If a bounce near resistance lacks volume, selling pressure remains overhead and the weak structure hasn’t been resolved. A break below support would make continued weakness clearer; if the price gets back above resistance, I’d have to acknowledge that this view is no longer valid—don’t fight the market.
This is only a market observation, not a trade recommendation. The resistance and support shown on the chart use the same set of 1-hour candlesticks as the text. Until a breakout is confirmed by volume, position sizing and stop-losses matter more than calling the direction.
On the 1-hour chart, the nearest resistance is at 128.41, with support at 109.21. The RSI is around 27, so a short-term oversold bounce is possible. The funding rate is about 0.0205%. If the price just moves back and forth between these two levels, it suggests the market is still repricing. Waiting for confirmation is steadier than chasing volatility.
Here’s what I’d watch in trading: if the rebound consistently fails to reclaim resistance, bears remain in control. If resistance is quickly reclaimed, that may indicate the downward momentum is fading. If the price breaks below support on rising volume, be alert for further weakness. If it moves back above resistance, the bearish thesis is invalidated.
My personal view: I care more about the quality of the rebound than whether the decline looks scary. If a bounce near resistance lacks volume, selling pressure remains overhead and the weak structure hasn’t been resolved. A break below support would make continued weakness clearer; if the price gets back above resistance, I’d have to acknowledge that this view is no longer valid—don’t fight the market.
This is only a market observation, not a trade recommendation. The resistance and support shown on the chart use the same set of 1-hour candlesticks as the text. Until a breakout is confirmed by volume, position sizing and stop-losses matter more than calling the direction.