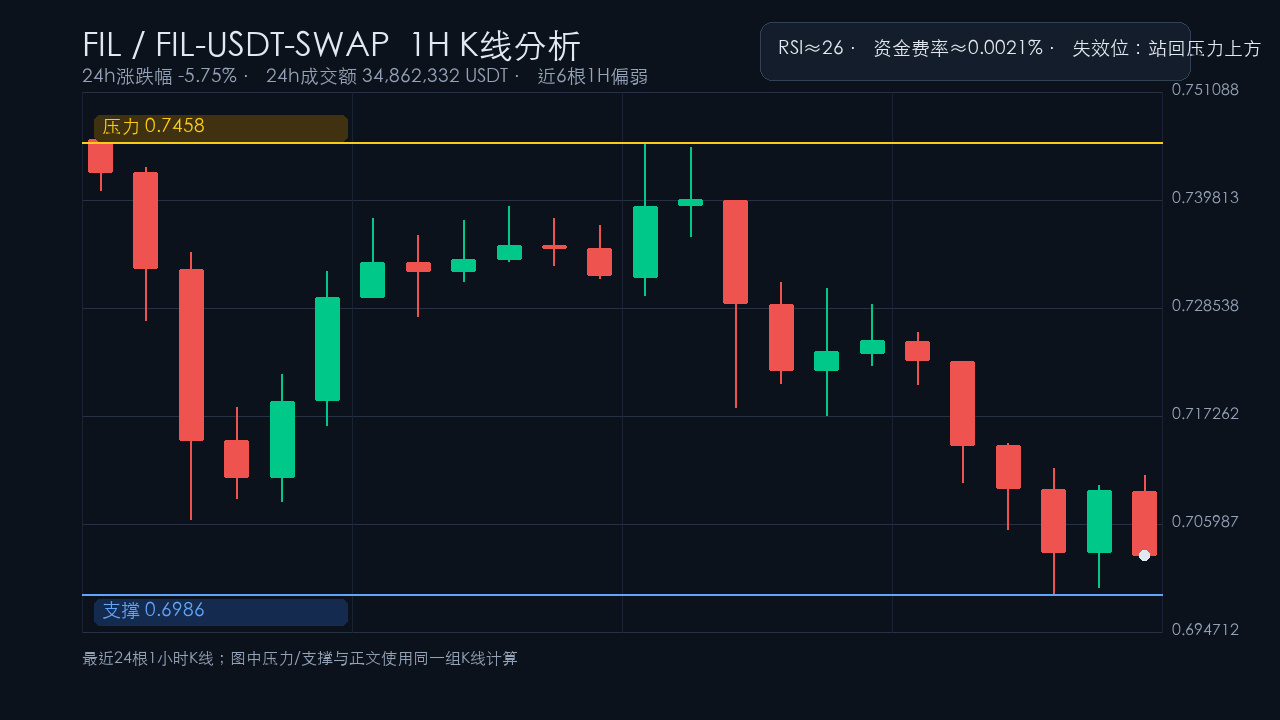

FIL has seen a fairly clear short-term move today, with 24-hour trading volume of approximately 34,862,332USDT and a 24-hour change of approximately -5.75%. The 24-hour trend and the near-term 1-hour trend are currently aligned, both leaning weak. The last 6 hourly candles have moved approximately -2.82%. In this kind of market, it’s better to watch key levels rather than focus only on the percentage change.
On the 1-hour chart, near-term resistance is at 0.7458, with support at 0.6986. The RSI is around 26, so a short-term oversold bounce is possible. The funding rate is approximately 0.0021%. If the price just oscillates between these two levels, it suggests the market is still repricing; waiting for confirmation is steadier than chasing volatility.
Here’s how I’d watch the trade: if the rebound consistently fails to reclaim resistance, the bears remain in control. A quick reclaim of resistance would suggest that downside momentum may be fading. A high-volume break below support warrants caution about further weakness; a move back above resistance would invalidate the bearish thesis.
My personal view: I’m more focused on the quality of any rebound than on whether the size of the drop looks scary. If the price bounces back toward resistance but volume fails to follow, selling pressure remains overhead and the weak structure hasn’t been broken. A break below support would make the continuation of weakness clearer; if the price moves back above resistance, I’d have to admit that this read was wrong—don’t fight the market.
This is just market commentary, not a trade signal. The resistance and support levels on the chart use the same set of 1-hour candles as the text. Until there’s confirmation from higher volume, position sizing and stop-losses matter more than picking a direction.
On the 1-hour chart, near-term resistance is at 0.7458, with support at 0.6986. The RSI is around 26, so a short-term oversold bounce is possible. The funding rate is approximately 0.0021%. If the price just oscillates between these two levels, it suggests the market is still repricing; waiting for confirmation is steadier than chasing volatility.
Here’s how I’d watch the trade: if the rebound consistently fails to reclaim resistance, the bears remain in control. A quick reclaim of resistance would suggest that downside momentum may be fading. A high-volume break below support warrants caution about further weakness; a move back above resistance would invalidate the bearish thesis.
My personal view: I’m more focused on the quality of any rebound than on whether the size of the drop looks scary. If the price bounces back toward resistance but volume fails to follow, selling pressure remains overhead and the weak structure hasn’t been broken. A break below support would make the continuation of weakness clearer; if the price moves back above resistance, I’d have to admit that this read was wrong—don’t fight the market.
This is just market commentary, not a trade signal. The resistance and support levels on the chart use the same set of 1-hour candles as the text. Until there’s confirmation from higher volume, position sizing and stop-losses matter more than picking a direction.