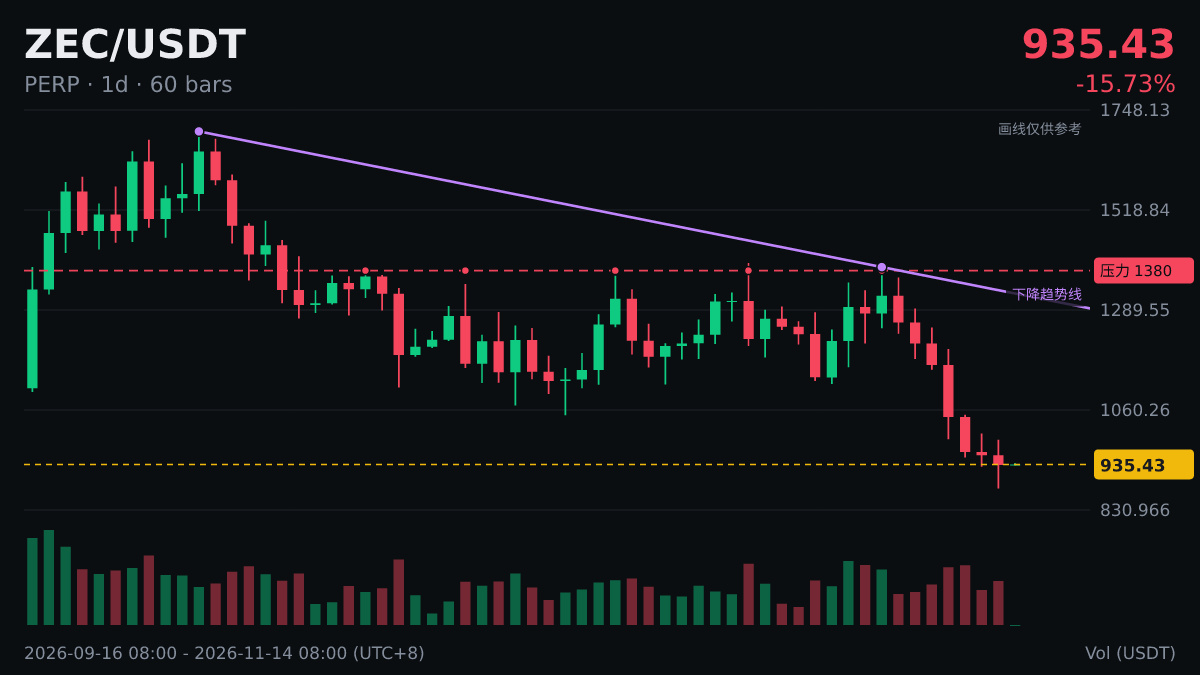

Technical Note|$ZEC |7 consecutive bearish daily candles|Cumulative -29.37%
Definition: Consecutive bullish or bearish candles simply count how many K-line candles in a row have the same color, without considering the size of each candle’s body. A few small bullish candles and a few large bullish candles carry very different weight.
Common interpretation: Consecutive candles of the same color on a daily chart can also appear in a range-bound market. Several daily candles with small bodies may all be bullish or bearish, while the overall move remains limited. In this case, the consecutive bullish or bearish pattern is not very meaningful.
Learning to read indicators isn’t difficult; the hard part is still following the rules when the market is at its most exciting.
Definition: Consecutive bullish or bearish candles simply count how many K-line candles in a row have the same color, without considering the size of each candle’s body. A few small bullish candles and a few large bullish candles carry very different weight.
Common interpretation: Consecutive candles of the same color on a daily chart can also appear in a range-bound market. Several daily candles with small bodies may all be bullish or bearish, while the overall move remains limited. In this case, the consecutive bullish or bearish pattern is not very meaningful.
Learning to read indicators isn’t difficult; the hard part is still following the rules when the market is at its most exciting.