I've been asked about this several times, so I'll explain it here.
A candlestick shows four prices over a given period: the opening, high, low, and closing prices.
The length of the body shows the price movement from open to close during that period, while the length of the wick shows how much the price rebounded after hitting a low.
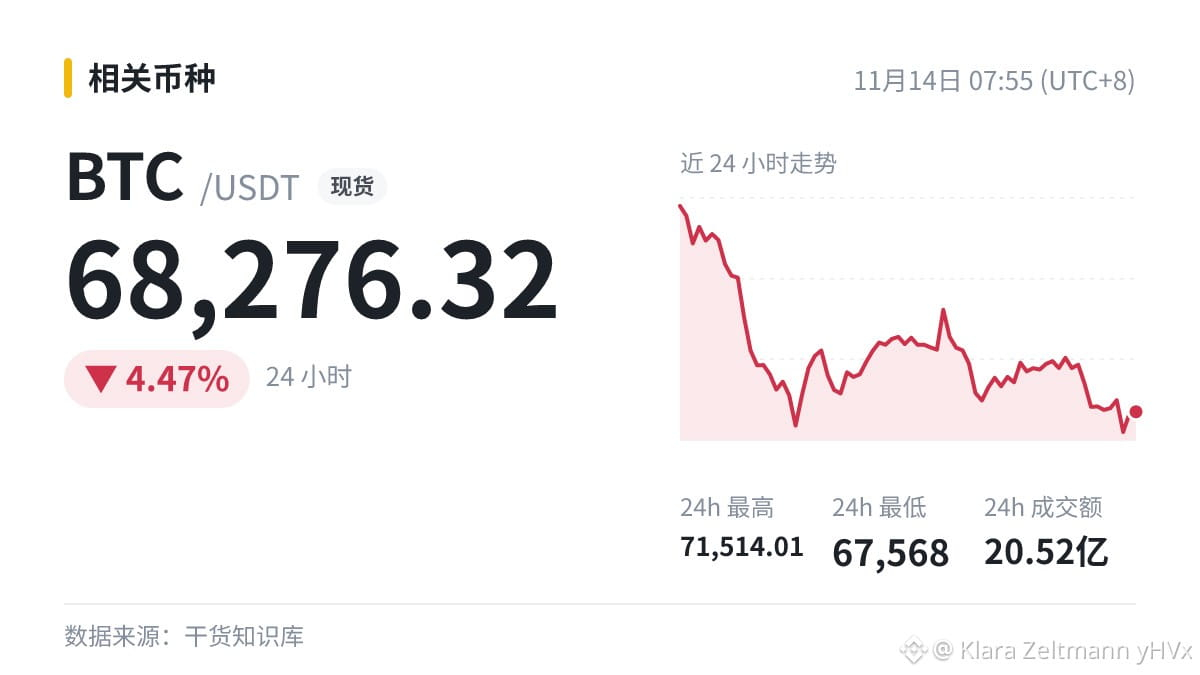
Related coin: $BTC Current price: 68276.32 (24h -4.47%).
What else would you like to know about? Let us know in the comments.
Opinions are for discussion only. You assume all risk.
A candlestick shows four prices over a given period: the opening, high, low, and closing prices.
The length of the body shows the price movement from open to close during that period, while the length of the wick shows how much the price rebounded after hitting a low.
Related coin: $BTC Current price: 68276.32 (24h -4.47%).
What else would you like to know about? Let us know in the comments.
Opinions are for discussion only. You assume all risk.