$TRX Alert! Is this distribution or just a shakeout before the next leg up? 🚨
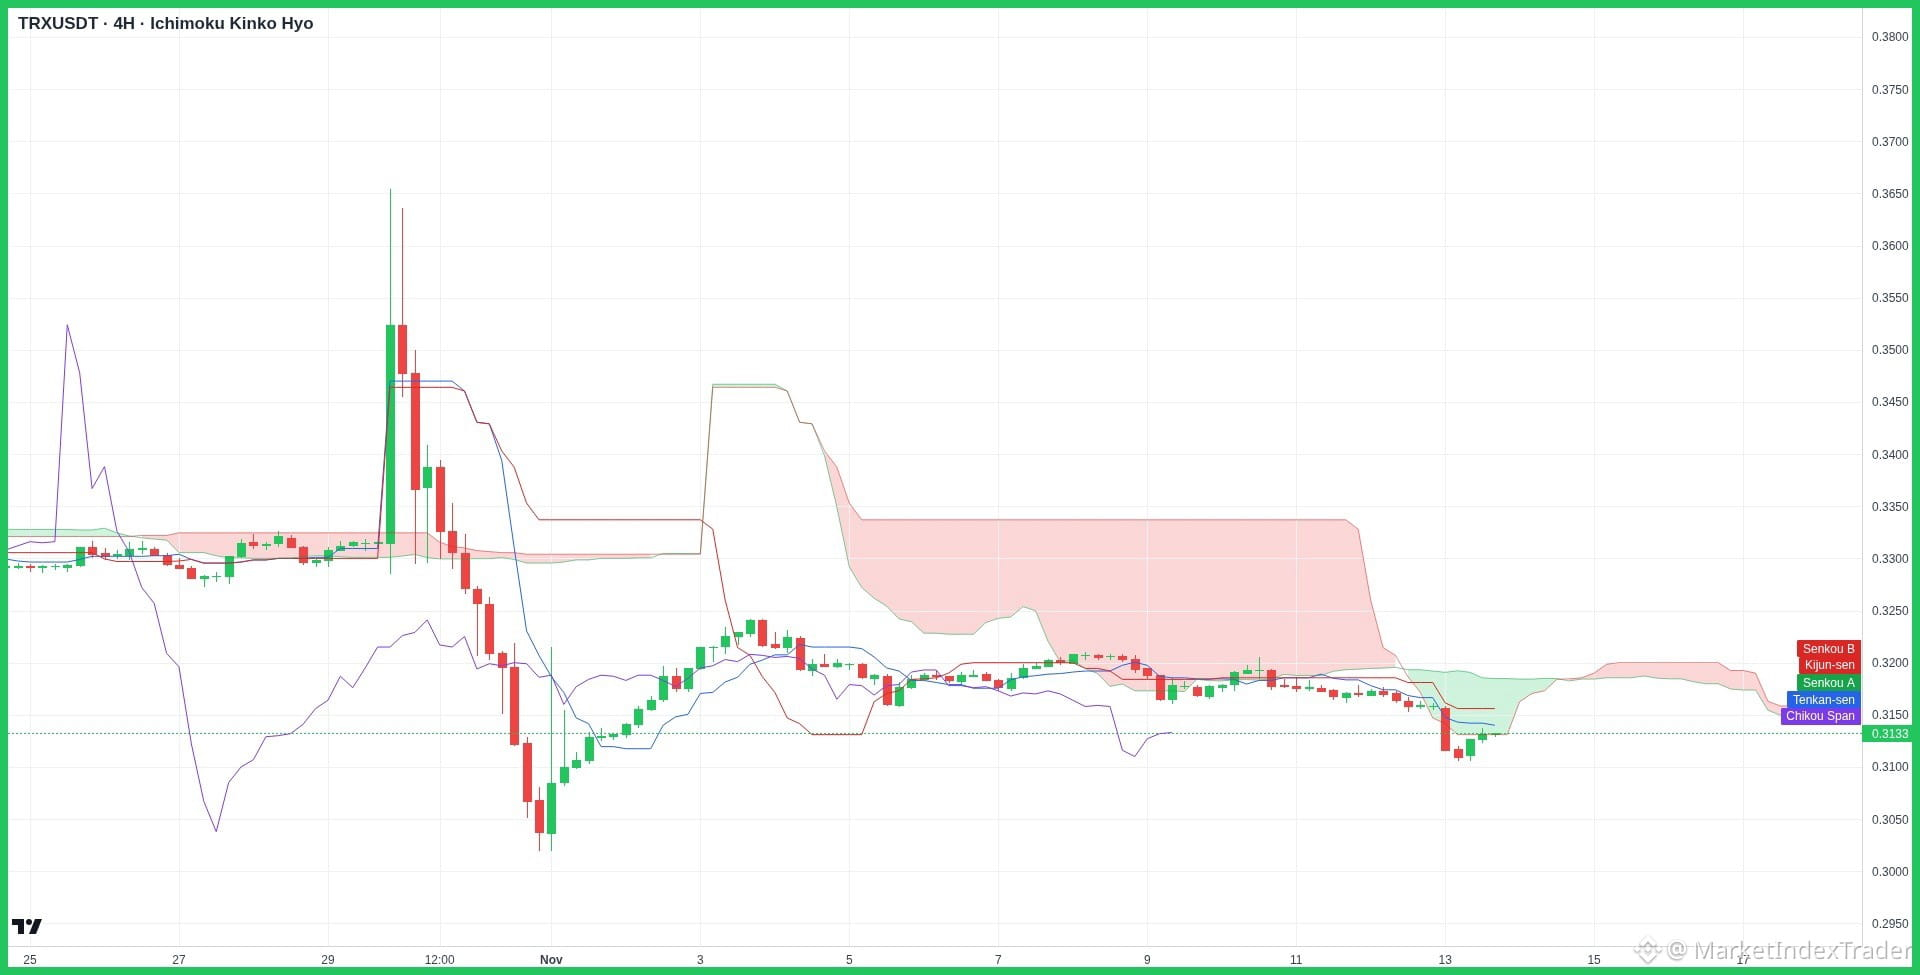
$TRX's 4H chart shows price finding support near $0.3100 while attempting a breakout through Ichimoku cloud resistance.
Alright team, let's break down this juicy $TRX chart and see what's cooking.
Technical Analysis
$TRX is currently consolidating around the $0.3133 level on the 4-hour timeframe after bouncing off key support at $0.3050 - $0.3100. Price is now testing immediate resistance near the Tenkan-sen and Kijun-sen zone around $0.3180 - $0.3200, which aligns with the lower boundary of the Ichimoku Cloud. A clean breakout above $0.3200 would clear the path for a retest of the major resistance high near $0.3350 - $0.3470.
Fundamental Analysis
On the fundamental side, the TRON network continues to demonstrate massive ecosystem strength with industry-leading daily active user metrics and revenue from stablecoin activity. Consistent $TRX token burns keep the asset's supply dynamics highly favorable, providing strong long-term momentum.
Action Plan
My strategy here is to watch for a confirmed 4H candle close above $0.3200 before taking a long position targeting $0.3350+. Risk management is key—keep stop losses tight below the $0.3050 support level.
Highly recommend HOLD and Stacking $TRX at Binance
Feel free to comment the altcoin you are holding and we will check it for you!
TRX #TechnicalAnalysis #Crypto #BinanceSquare #Bitcoin
$TRX's 4H chart shows price finding support near $0.3100 while attempting a breakout through Ichimoku cloud resistance.
Alright team, let's break down this juicy $TRX chart and see what's cooking.
Technical Analysis
$TRX is currently consolidating around the $0.3133 level on the 4-hour timeframe after bouncing off key support at $0.3050 - $0.3100. Price is now testing immediate resistance near the Tenkan-sen and Kijun-sen zone around $0.3180 - $0.3200, which aligns with the lower boundary of the Ichimoku Cloud. A clean breakout above $0.3200 would clear the path for a retest of the major resistance high near $0.3350 - $0.3470.
Fundamental Analysis
On the fundamental side, the TRON network continues to demonstrate massive ecosystem strength with industry-leading daily active user metrics and revenue from stablecoin activity. Consistent $TRX token burns keep the asset's supply dynamics highly favorable, providing strong long-term momentum.
Action Plan
My strategy here is to watch for a confirmed 4H candle close above $0.3200 before taking a long position targeting $0.3350+. Risk management is key—keep stop losses tight below the $0.3050 support level.
Highly recommend HOLD and Stacking $TRX at Binance
Feel free to comment the altcoin you are holding and we will check it for you!
TRX #TechnicalAnalysis #Crypto #BinanceSquare #Bitcoin