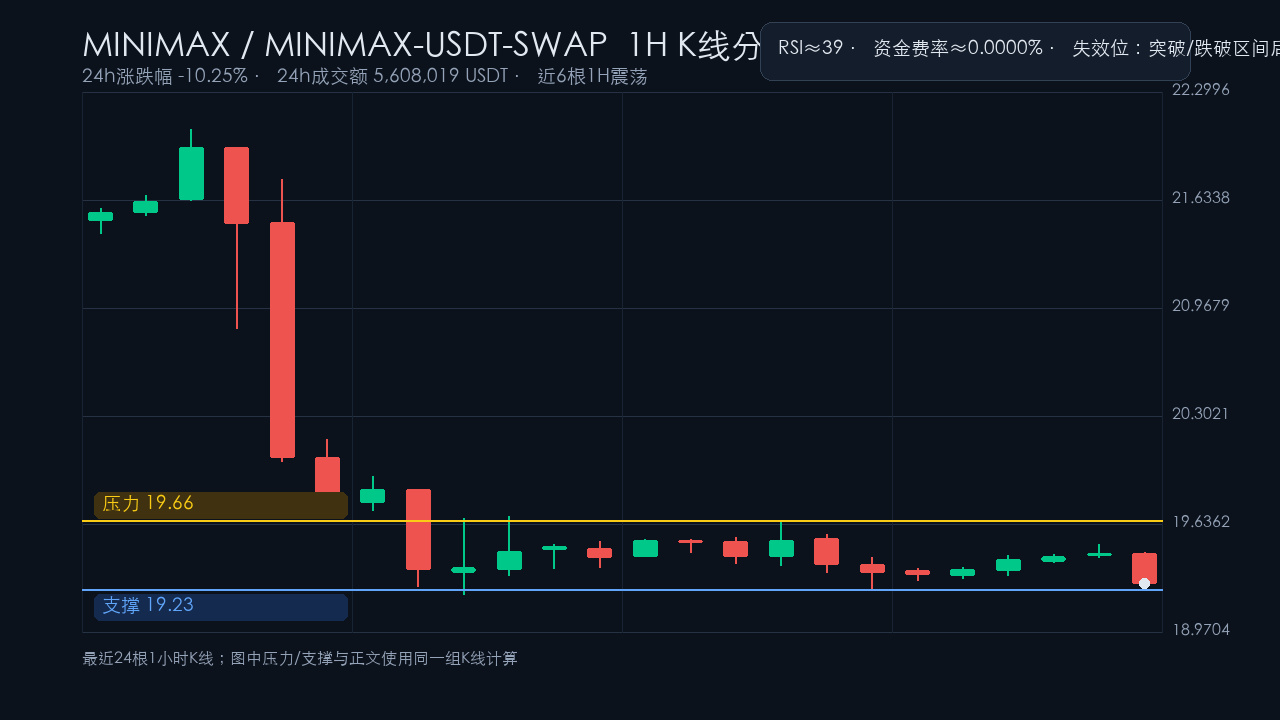

MINIMAX is showing relatively noticeable volatility right now, with 24-hour trading volume of approximately 5,608,019 USDT and a 24-hour change of about -10.25%. Overall, the 24-hour trend is weak, but the last six 1-hour candles have moved about -0.31%, and the near-term action has shifted into a range. These two time frames should not be conflated. In this kind of market, it’s better to watch key levels rather than focus only on the percentage change.
On the 1-hour chart, near-term resistance is around 19.66, with support around 19.23. RSI is approximately 39, putting momentum in neutral territory, and the funding rate is about 0.0000%. If price simply moves back and forth between these two levels, it suggests the market is still repricing. Waiting for confirmation is steadier than chasing volatility.
Here’s how I’d approach it: the market currently looks more like range-bound trading, so it’s better to wait and assess direction after a break above resistance or below support rather than chase moves prematurely. Until the range breaks, treat the short-term action as a back-and-forth struggle between resistance and support.
My personal view: with this kind of market, I generally don’t try to guess which way it will turn next. When price is whipsawing between resistance and support, entering early can easily get you shaken out. A breakout above resistance on increased volume suggests buyers are willing to keep repricing it; a break below support would indicate that the short-term balance has weakened. Waiting for confirmation is more reliable than trading frequently in the middle of the range.
This is only a market observation, not a trade signal. The resistance and support levels shown on the chart use the same set of 1-hour candles as the text. Until there’s confirmation from increased volume, position sizing and stop-losses matter more than calling the direction.
On the 1-hour chart, near-term resistance is around 19.66, with support around 19.23. RSI is approximately 39, putting momentum in neutral territory, and the funding rate is about 0.0000%. If price simply moves back and forth between these two levels, it suggests the market is still repricing. Waiting for confirmation is steadier than chasing volatility.
Here’s how I’d approach it: the market currently looks more like range-bound trading, so it’s better to wait and assess direction after a break above resistance or below support rather than chase moves prematurely. Until the range breaks, treat the short-term action as a back-and-forth struggle between resistance and support.
My personal view: with this kind of market, I generally don’t try to guess which way it will turn next. When price is whipsawing between resistance and support, entering early can easily get you shaken out. A breakout above resistance on increased volume suggests buyers are willing to keep repricing it; a break below support would indicate that the short-term balance has weakened. Waiting for confirmation is more reliable than trading frequently in the middle of the range.
This is only a market observation, not a trade signal. The resistance and support levels shown on the chart use the same set of 1-hour candles as the text. Until there’s confirmation from increased volume, position sizing and stop-losses matter more than calling the direction.