🔥 $ZEC Technical Update: Key Levels & Momentum Breakdown
📊 1. Market Snapshot
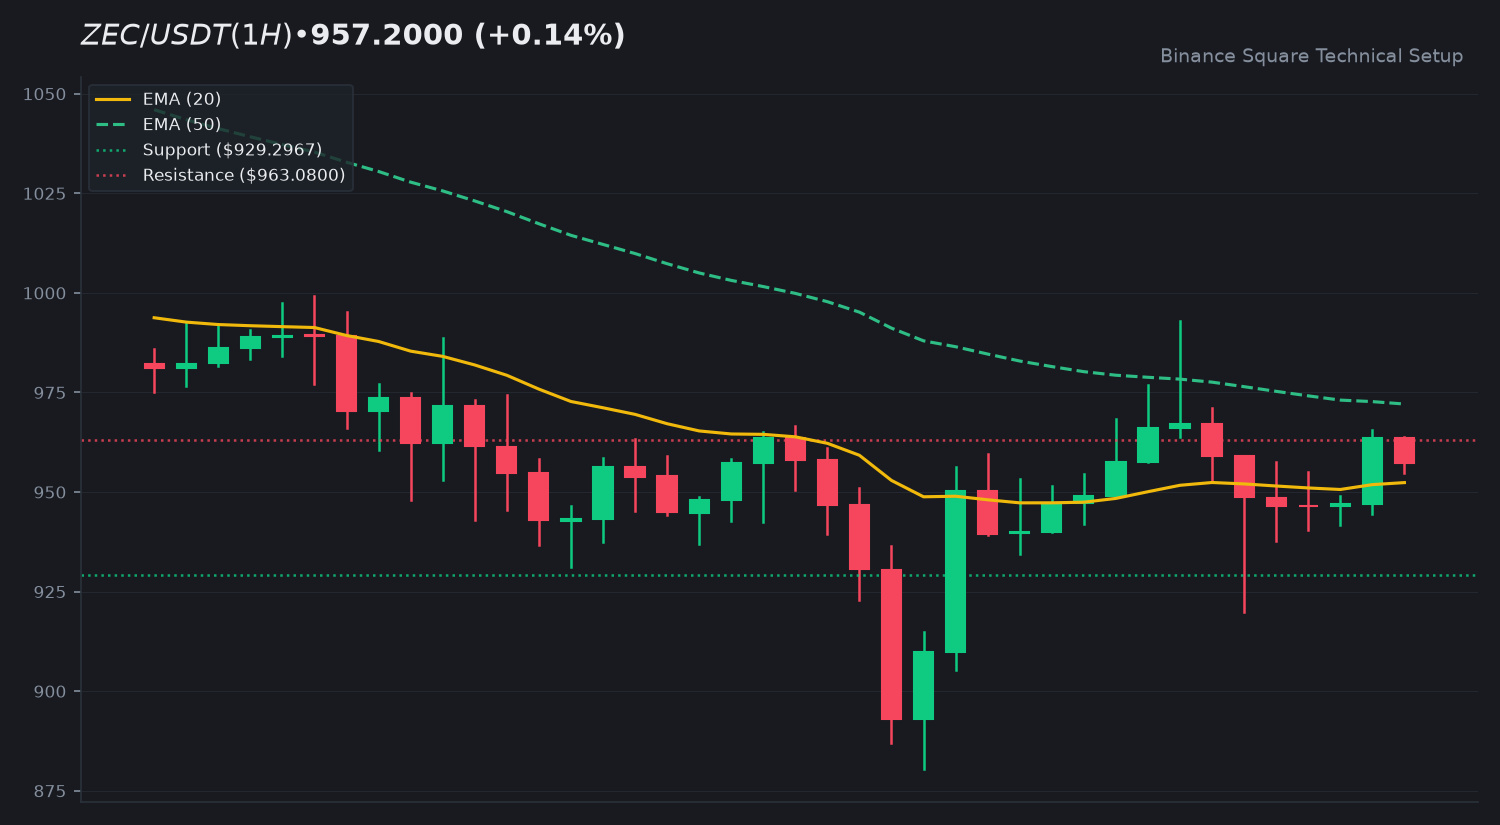
$ZEC is currently trading at $957.20, registering a marginal 24h change of +0.14%. Daily price action ranges between a high of 992.98 and a low of 880.50, supported by a 24h quote volume of 231.64 million USDT.
📈 2. Technical Momentum & Indicator Bias
Technical Momentum & Market Bias shows a neutral-to-bullish recovery attempt. The price sits right near the EMA 20 at 952.37 while remaining just below the EMA 50 at 972.10. The RSI (14) prints at 51.3, reflecting market equilibrium. Meanwhile, the MACD histogram shows a positive print of +2.5389 with the MACD line crossing above the signal line, indicating early bullish structural repair. However, volume remains relatively thin at a 0.19x ratio against the 20-SMA, signaling consolidation.
🎯 3. Key Technical Levels to Watch
• 🟢 Resistance Zone: Immediate resistance is located at 963.08, with a higher supply extension target at $1,007.7180.
• 🔴 Support Zone: First key support floor rests at 929.2967, backed by the 24h low at 880.5000.
• 🛡️ Pivot Confluence: The EMA 20 at 952.37 serves as the primary short-term directional pivot.
💡 4. Technical Takeaway & Risk Management
Price action is consolidating tightly around the fast moving average. Traders are monitoring whether volume expansion will accompany a break above the EMA 50 or if range-bound behavior persists between established horizontal boundaries.
💬 5. Community Discussion
What is your technical outlook for $ZEC this week? Are you monitoring the moving average crossover or waiting for a breakout confirmation? Drop your thoughts below! 👇
⚠️ 6. Disclaimer
Educational technical analysis only. Not financial advice (NFA). Crypto markets involve risk. Always DYOR.
$ZEC #ZEC #BinanceSquare
📊 1. Market Snapshot
$ZEC is currently trading at $957.20, registering a marginal 24h change of +0.14%. Daily price action ranges between a high of 992.98 and a low of 880.50, supported by a 24h quote volume of 231.64 million USDT.
📈 2. Technical Momentum & Indicator Bias
Technical Momentum & Market Bias shows a neutral-to-bullish recovery attempt. The price sits right near the EMA 20 at 952.37 while remaining just below the EMA 50 at 972.10. The RSI (14) prints at 51.3, reflecting market equilibrium. Meanwhile, the MACD histogram shows a positive print of +2.5389 with the MACD line crossing above the signal line, indicating early bullish structural repair. However, volume remains relatively thin at a 0.19x ratio against the 20-SMA, signaling consolidation.
🎯 3. Key Technical Levels to Watch
• 🟢 Resistance Zone: Immediate resistance is located at 963.08, with a higher supply extension target at $1,007.7180.
• 🔴 Support Zone: First key support floor rests at 929.2967, backed by the 24h low at 880.5000.
• 🛡️ Pivot Confluence: The EMA 20 at 952.37 serves as the primary short-term directional pivot.
💡 4. Technical Takeaway & Risk Management
Price action is consolidating tightly around the fast moving average. Traders are monitoring whether volume expansion will accompany a break above the EMA 50 or if range-bound behavior persists between established horizontal boundaries.
💬 5. Community Discussion
What is your technical outlook for $ZEC this week? Are you monitoring the moving average crossover or waiting for a breakout confirmation? Drop your thoughts below! 👇
⚠️ 6. Disclaimer
Educational technical analysis only. Not financial advice (NFA). Crypto markets involve risk. Always DYOR.
$ZEC #ZEC #BinanceSquare