$BNB Alert! Is this local bottom in or are we testing lower levels next? 🚨
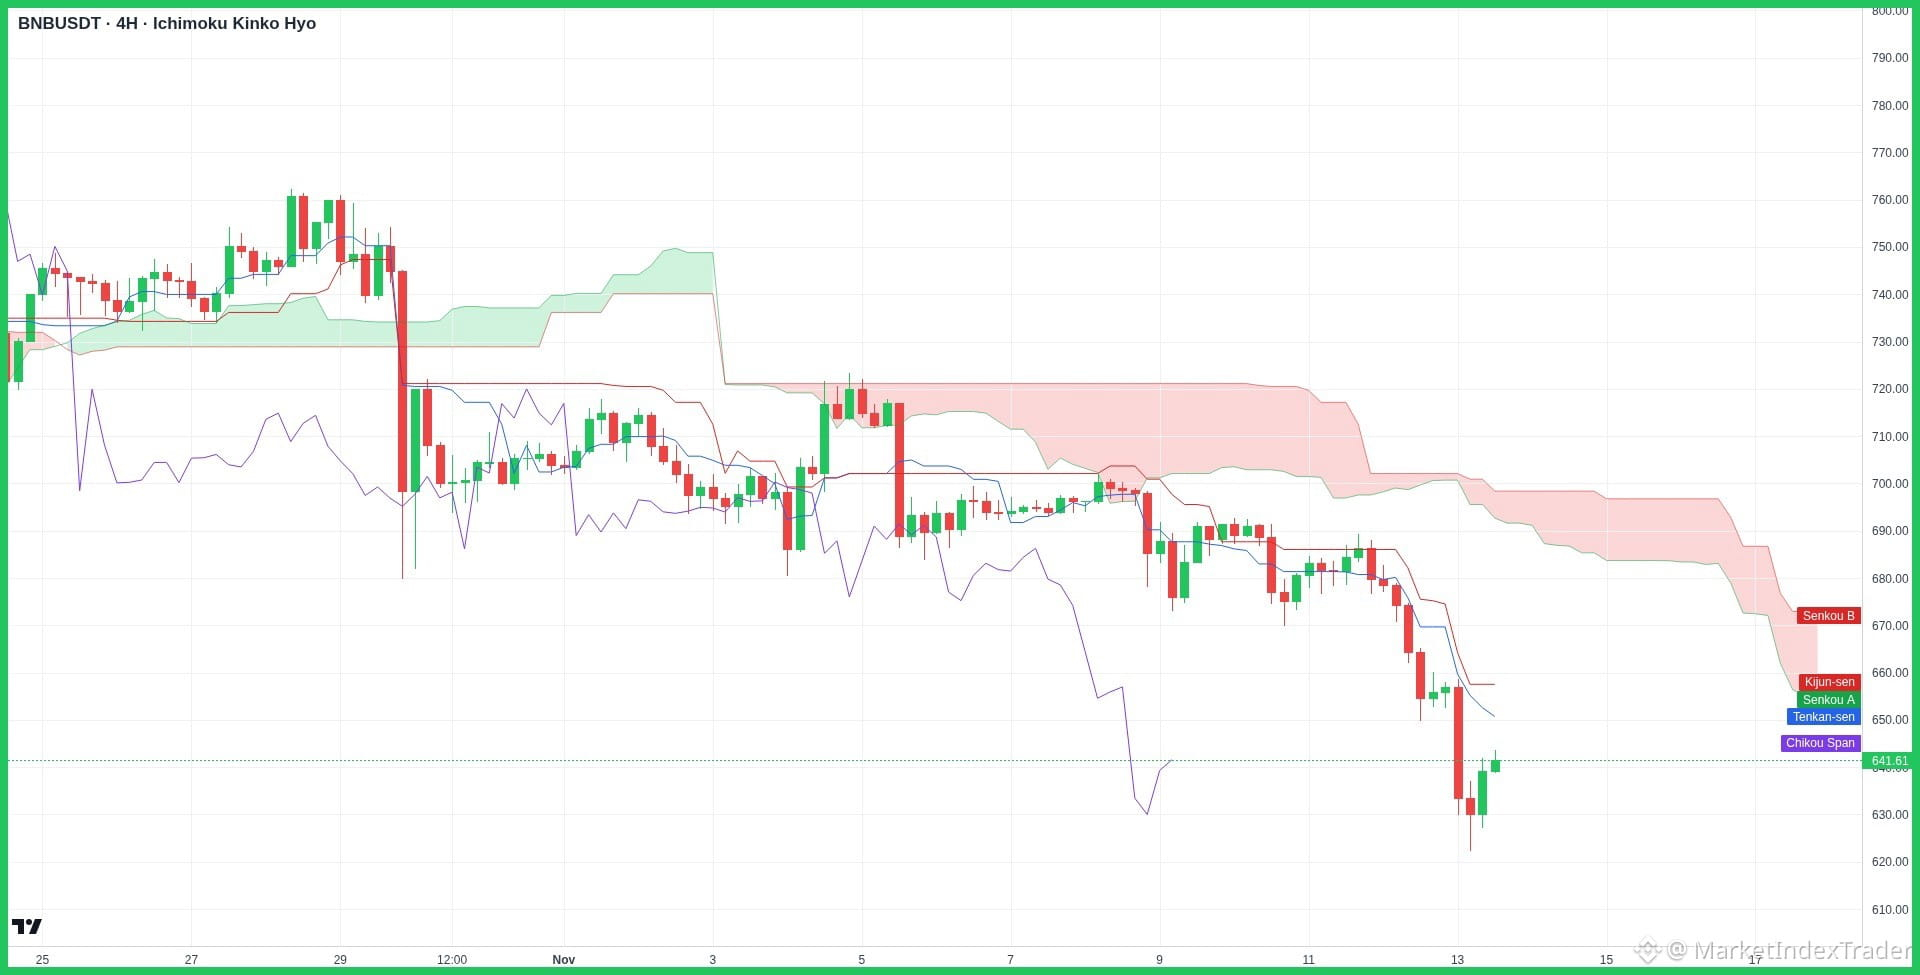
$BNB's 4H chart shows price consolidating near $641 below the Ichimoku Cloud after finding strong support at the $625 zone.
Alright team, let's break down this $BNB chart and see what's cooking on the 4H timeframe! 📉
Technical Analysis
Looking at the 4H Ichimoku Kinko Hyo indicator, $BNB recently took a sharp dip hitting a local low around $625, where buyers stepped in. Currently trading at $641.61, the price remains below the thick Kumo cloud, signaling short-term bearish dominance. The Tenkan-sen and Kijun-sen are acting as immediate overhead resistance between $650 - $660, with major cloud resistance higher up at $670 - $700. A breakout above $660 is needed to flip short-term momentum bullish.
Fundamental Analysis
On the fundamental side, the BNB ecosystem continues to demonstrate strong resilience and adoption. Continuous network upgrades, steady high transaction volumes on BNB Chain, and regular Launchpool utility provide strong underlying demand for $BNB despite broader market volatility.
Action Plan
For long-term holders, accumulating around key support zones like $620-$635 offers great risk-reward. A conservative entry strategy would be waiting for a confirmed candle close above $660 to target the $700+ range.
Highly recommend HOLD and Stacking $BNB at Binance
Feel free to comment the altcoin you are holding and we will check it for you!
BNB #TechnicalAnalysis #Crypto #BinanceSquare #Bitcoin
$BNB's 4H chart shows price consolidating near $641 below the Ichimoku Cloud after finding strong support at the $625 zone.
Alright team, let's break down this $BNB chart and see what's cooking on the 4H timeframe! 📉
Technical Analysis
Looking at the 4H Ichimoku Kinko Hyo indicator, $BNB recently took a sharp dip hitting a local low around $625, where buyers stepped in. Currently trading at $641.61, the price remains below the thick Kumo cloud, signaling short-term bearish dominance. The Tenkan-sen and Kijun-sen are acting as immediate overhead resistance between $650 - $660, with major cloud resistance higher up at $670 - $700. A breakout above $660 is needed to flip short-term momentum bullish.
Fundamental Analysis
On the fundamental side, the BNB ecosystem continues to demonstrate strong resilience and adoption. Continuous network upgrades, steady high transaction volumes on BNB Chain, and regular Launchpool utility provide strong underlying demand for $BNB despite broader market volatility.
Action Plan
For long-term holders, accumulating around key support zones like $620-$635 offers great risk-reward. A conservative entry strategy would be waiting for a confirmed candle close above $660 to target the $700+ range.
Highly recommend HOLD and Stacking $BNB at Binance
Feel free to comment the altcoin you are holding and we will check it for you!
BNB #TechnicalAnalysis #Crypto #BinanceSquare #Bitcoin