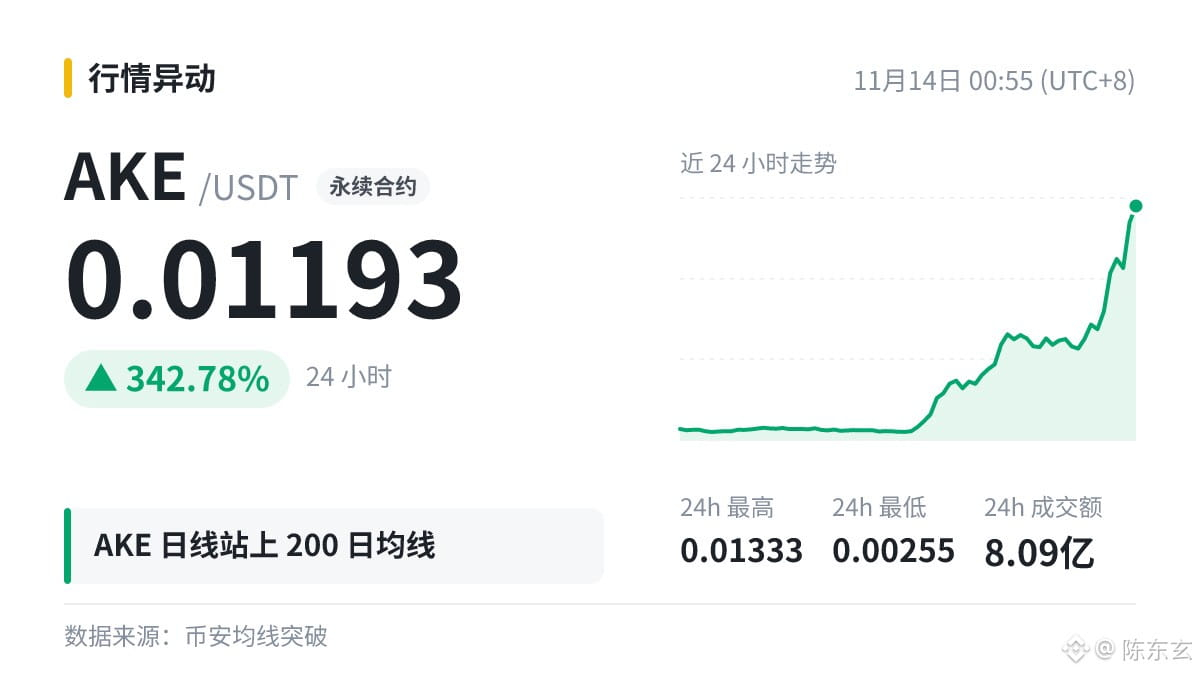
$AKE |Daily chart above MA200|MA200 0.01022
Before discussing capital flows, first understand moving averages.
To confirm a break above or below, many people use the daily closing price. It’s common for the price to cross a level intraday and then move back across it before the close.
When the price is far from a long-term moving average, it’s often thought likely to move back toward it. But during a strong trend, this divergence can persist for quite a long time.
Extreme readings often mean greater volatility. At times like these, it’s better to reduce your position rather than add to it.
Before discussing capital flows, first understand moving averages.
To confirm a break above or below, many people use the daily closing price. It’s common for the price to cross a level intraday and then move back across it before the close.
When the price is far from a long-term moving average, it’s often thought likely to move back toward it. But during a strong trend, this divergence can persist for quite a long time.
Extreme readings often mean greater volatility. At times like these, it’s better to reduce your position rather than add to it.