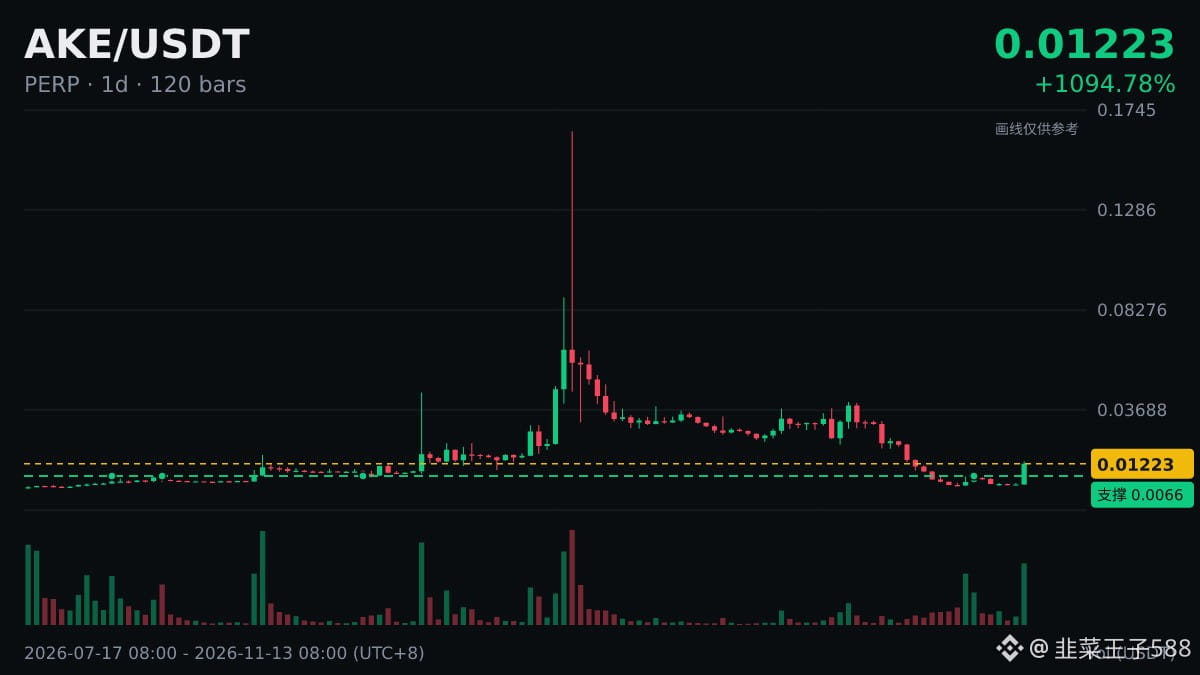
📈 $AKE daily chart is above MA200 (0.01022), with the current price at 0.01223.
After a rally, there is usually some disagreement; the pullback will reveal what’s really going on. How do you interpret these figures?
Personal notes only, not specific trading advice.
After a rally, there is usually some disagreement; the pullback will reveal what’s really going on. How do you interpret these figures?
Personal notes only, not specific trading advice.