Trading Thesis | 11/14 00:20
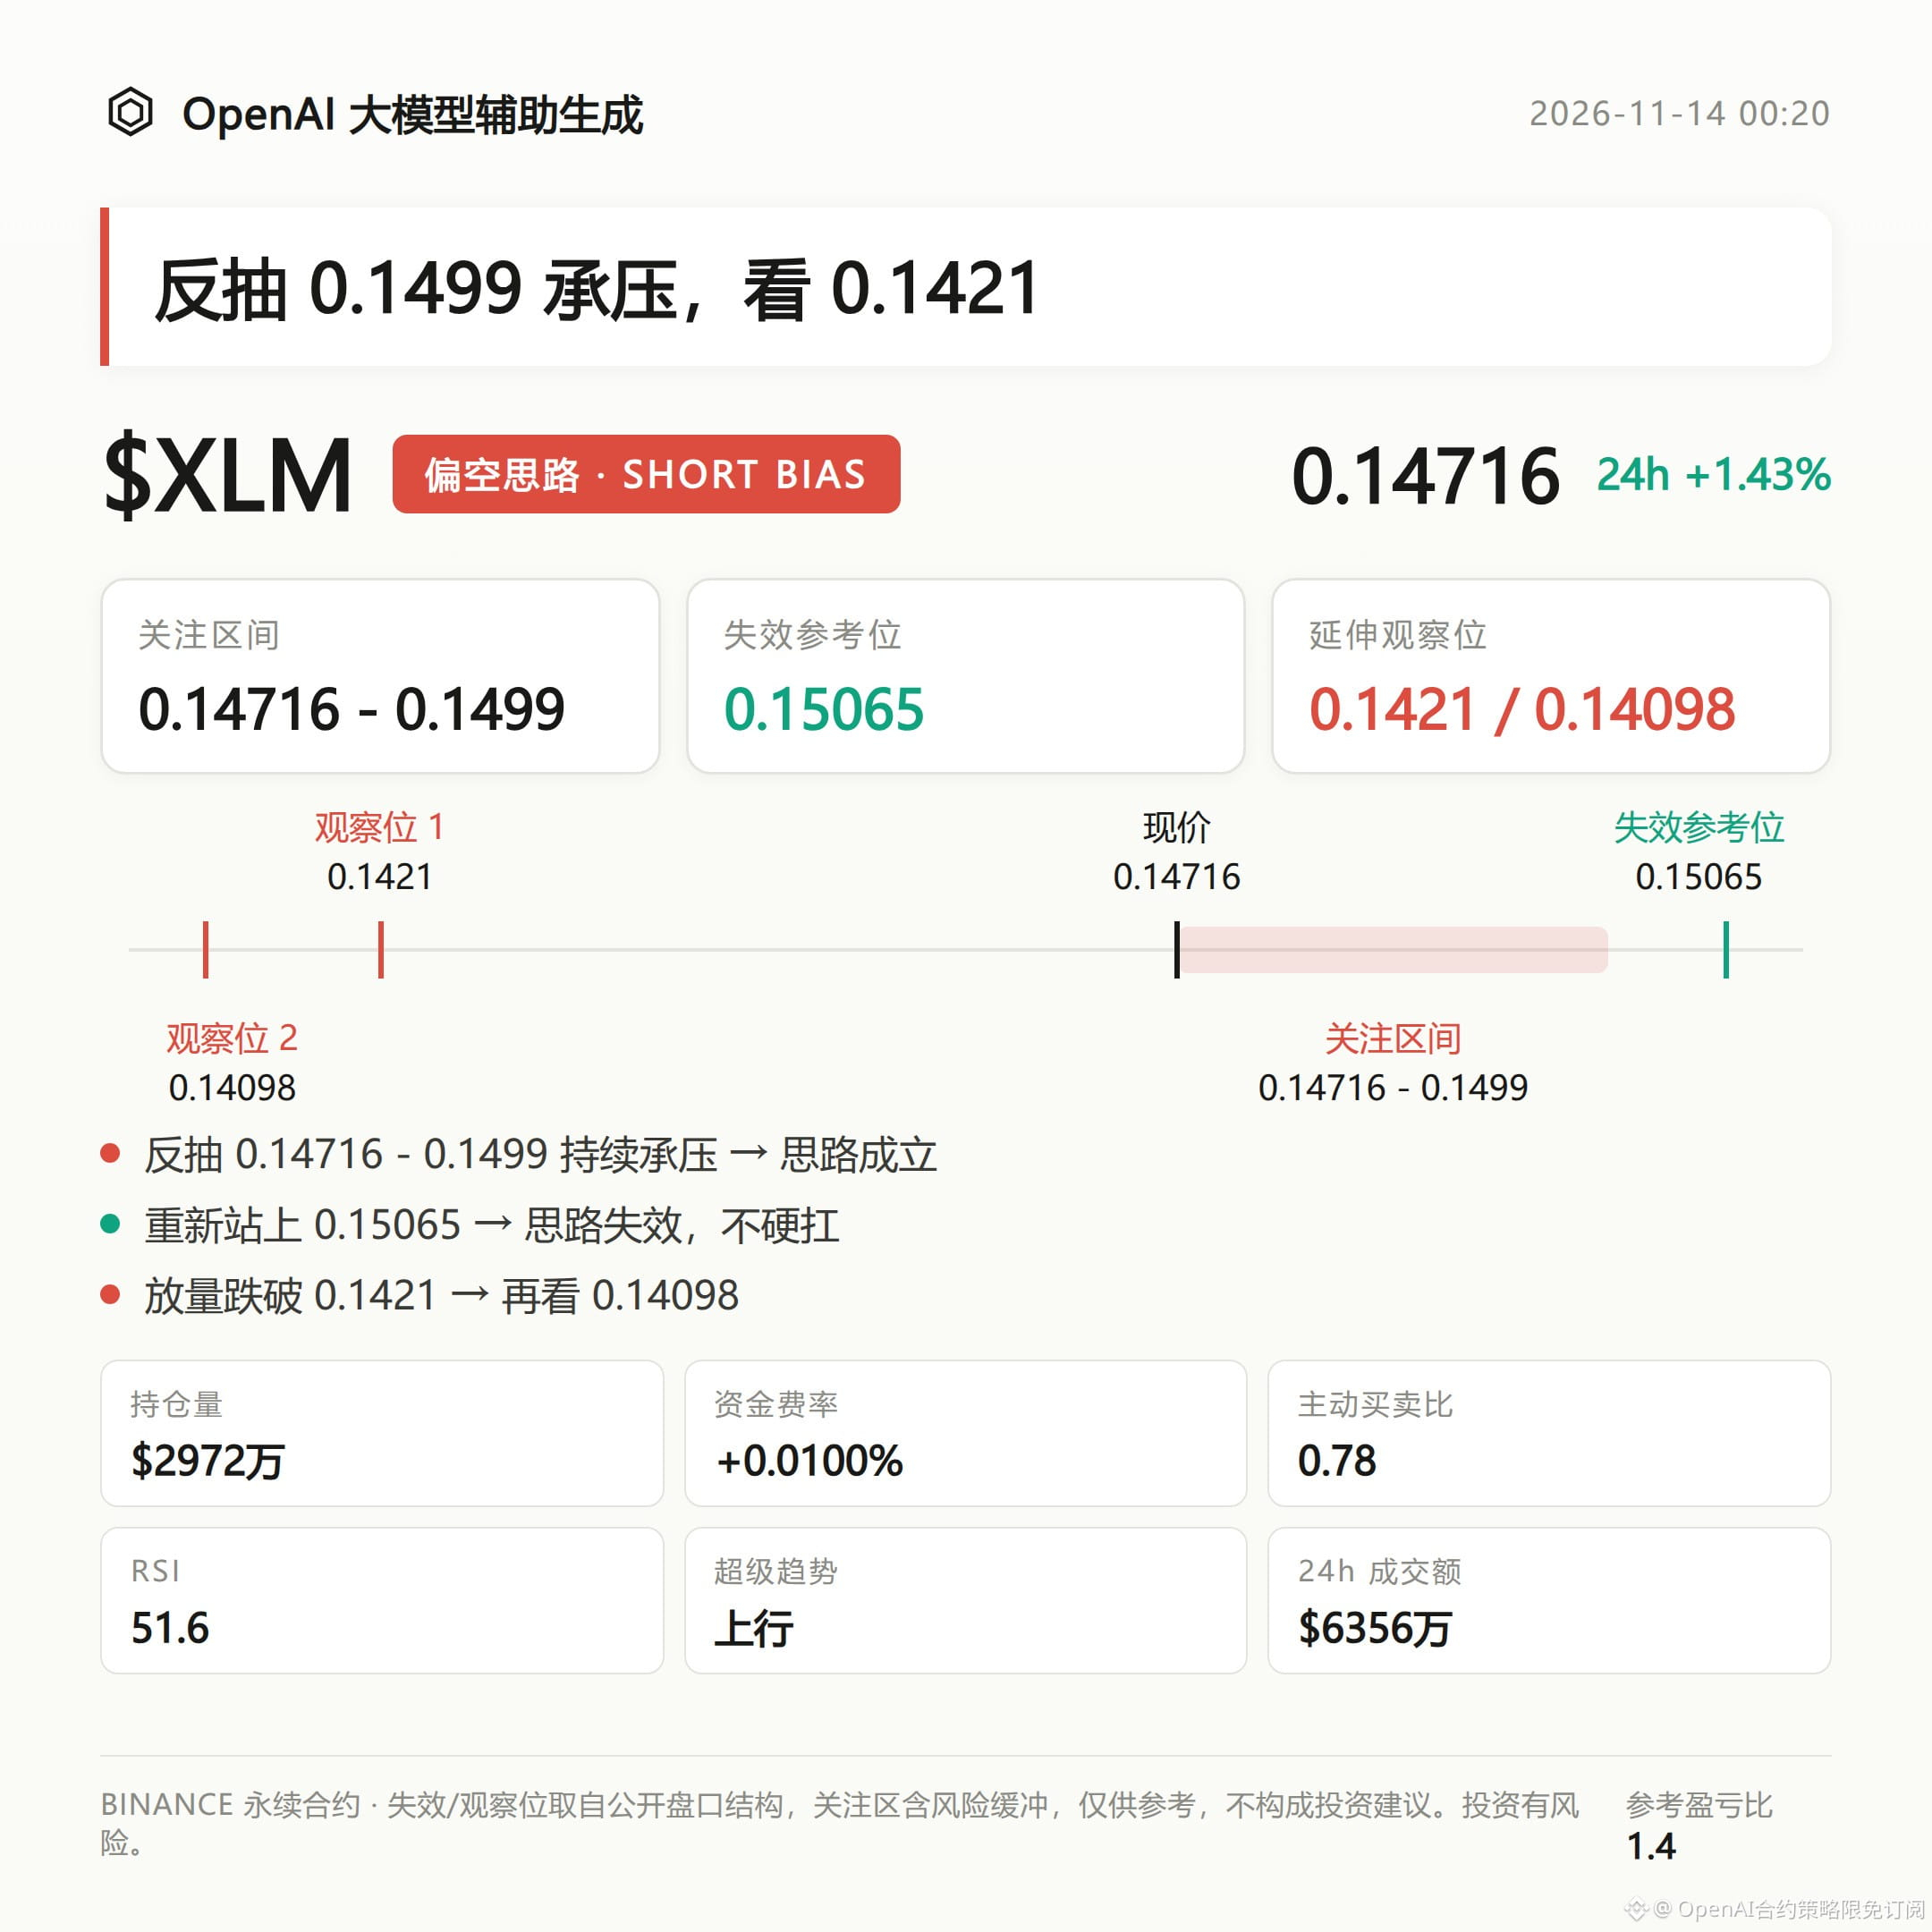
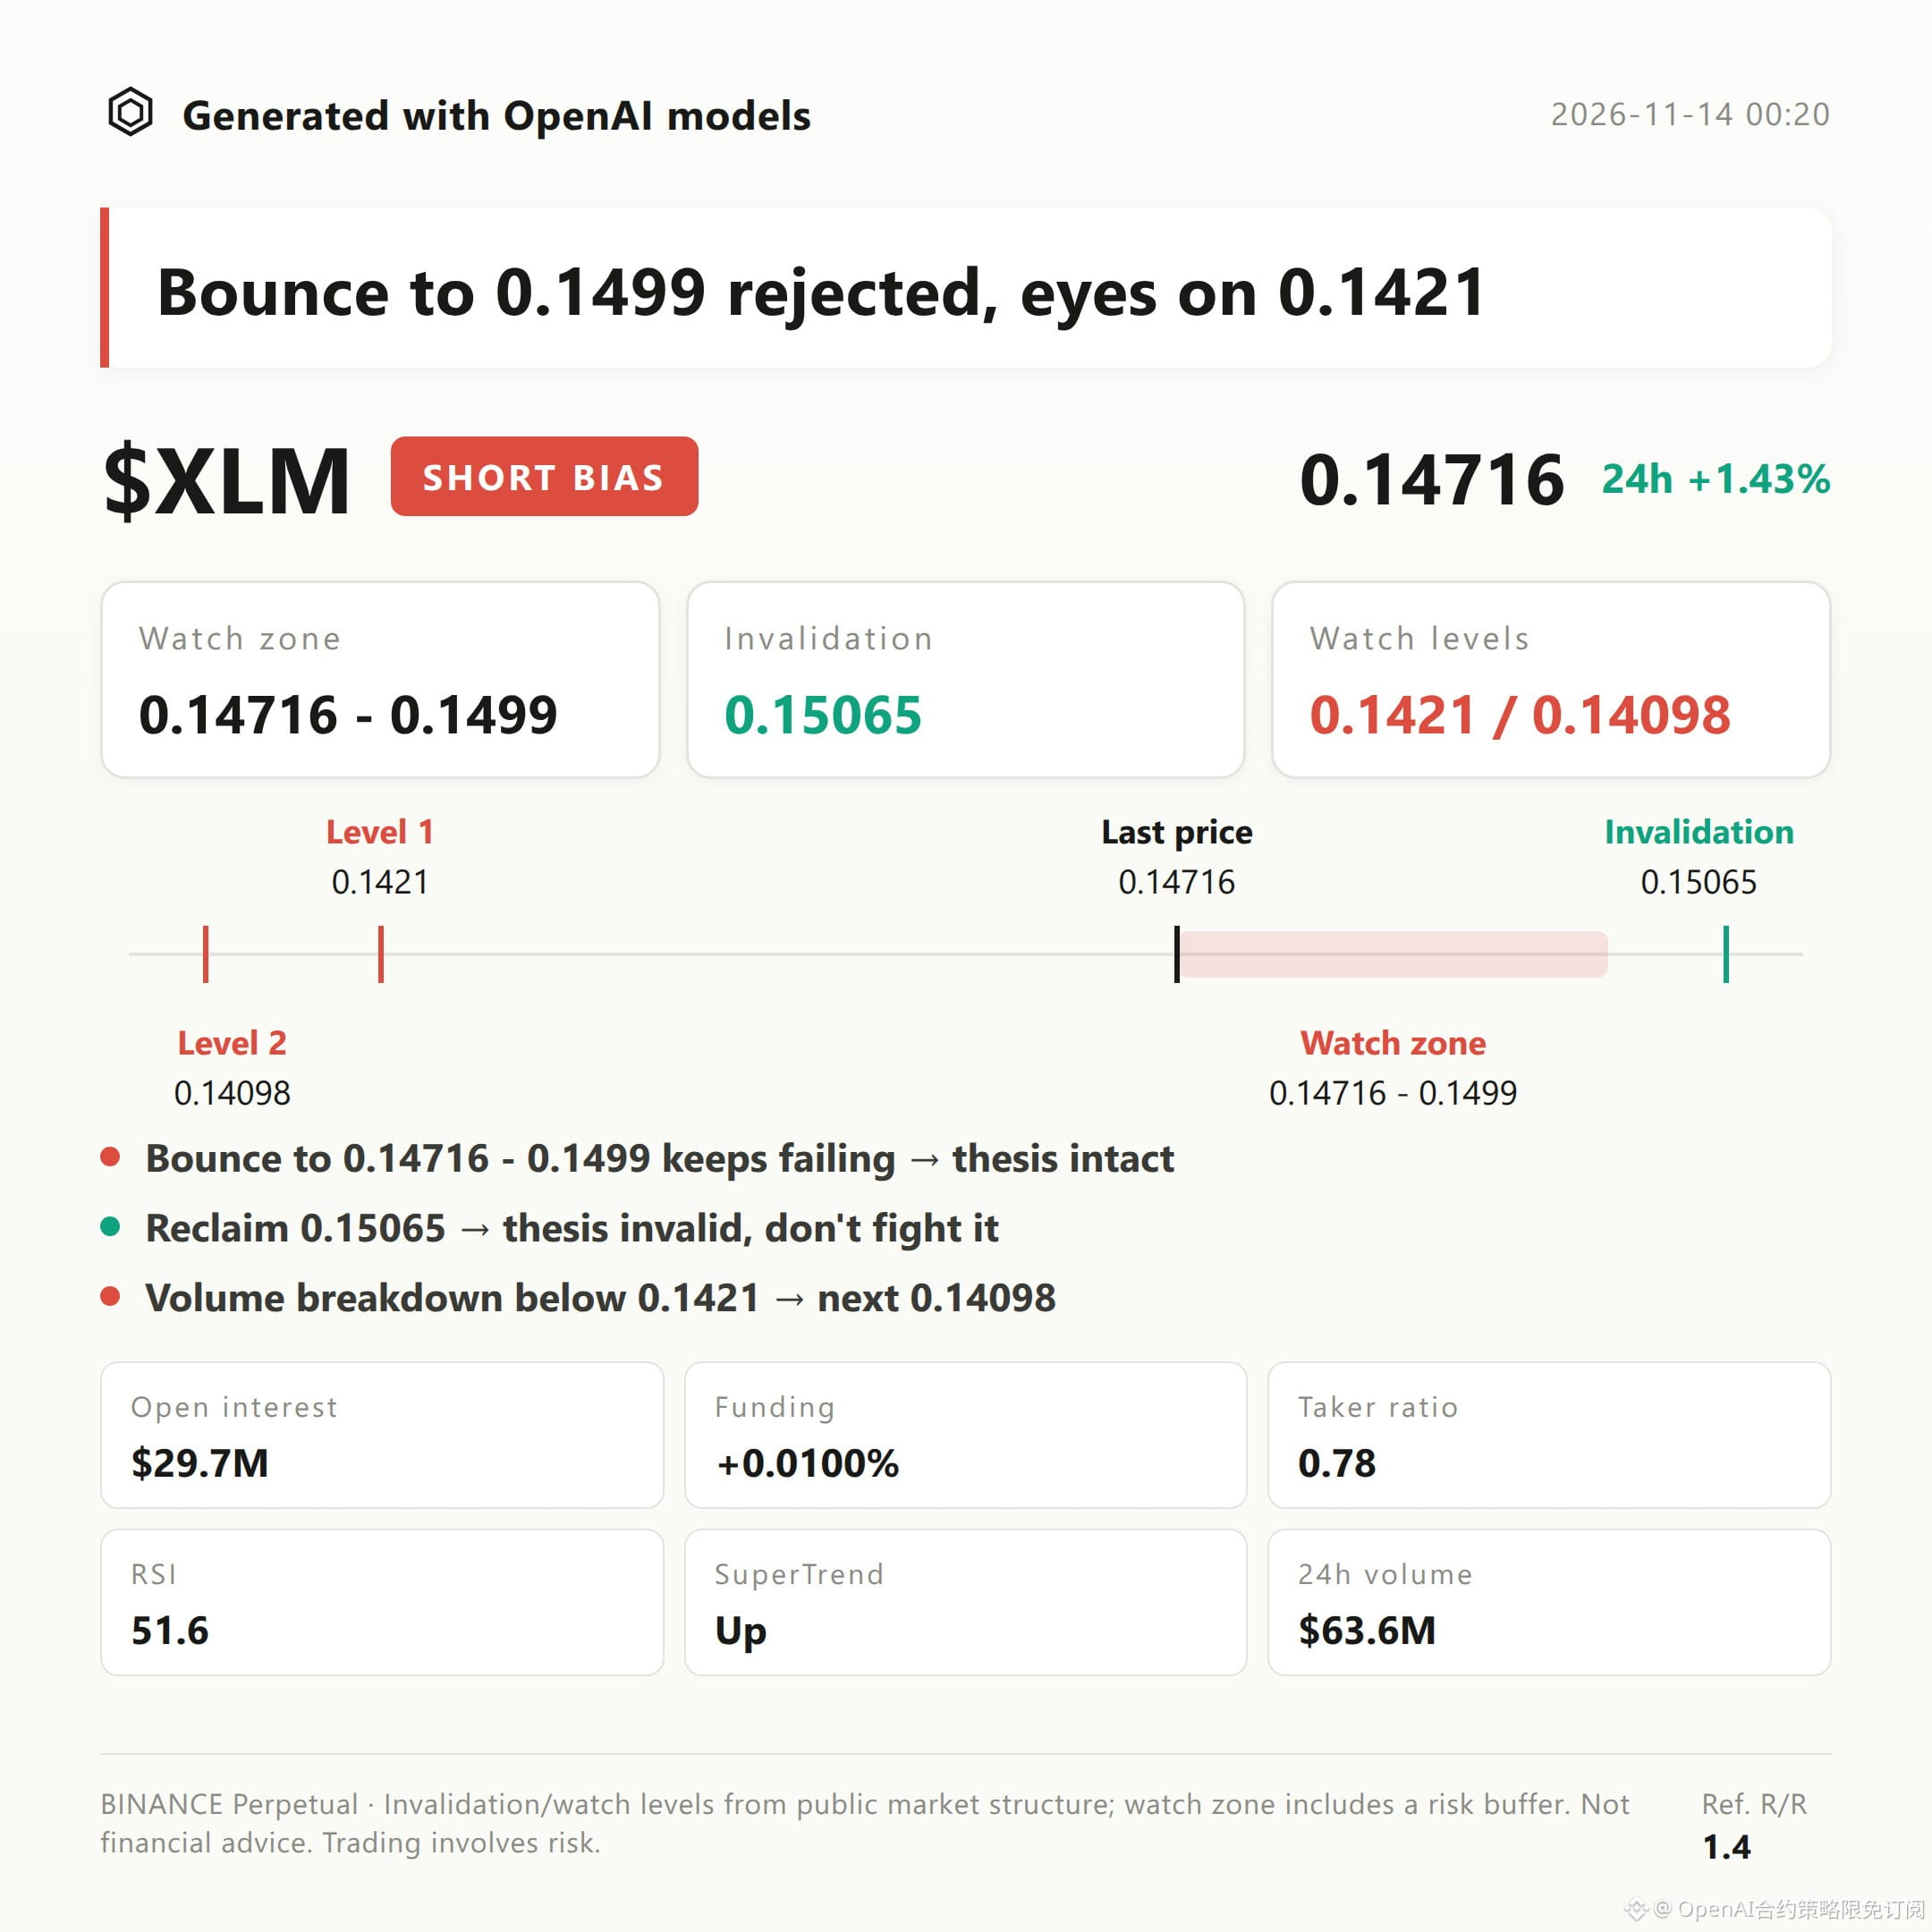
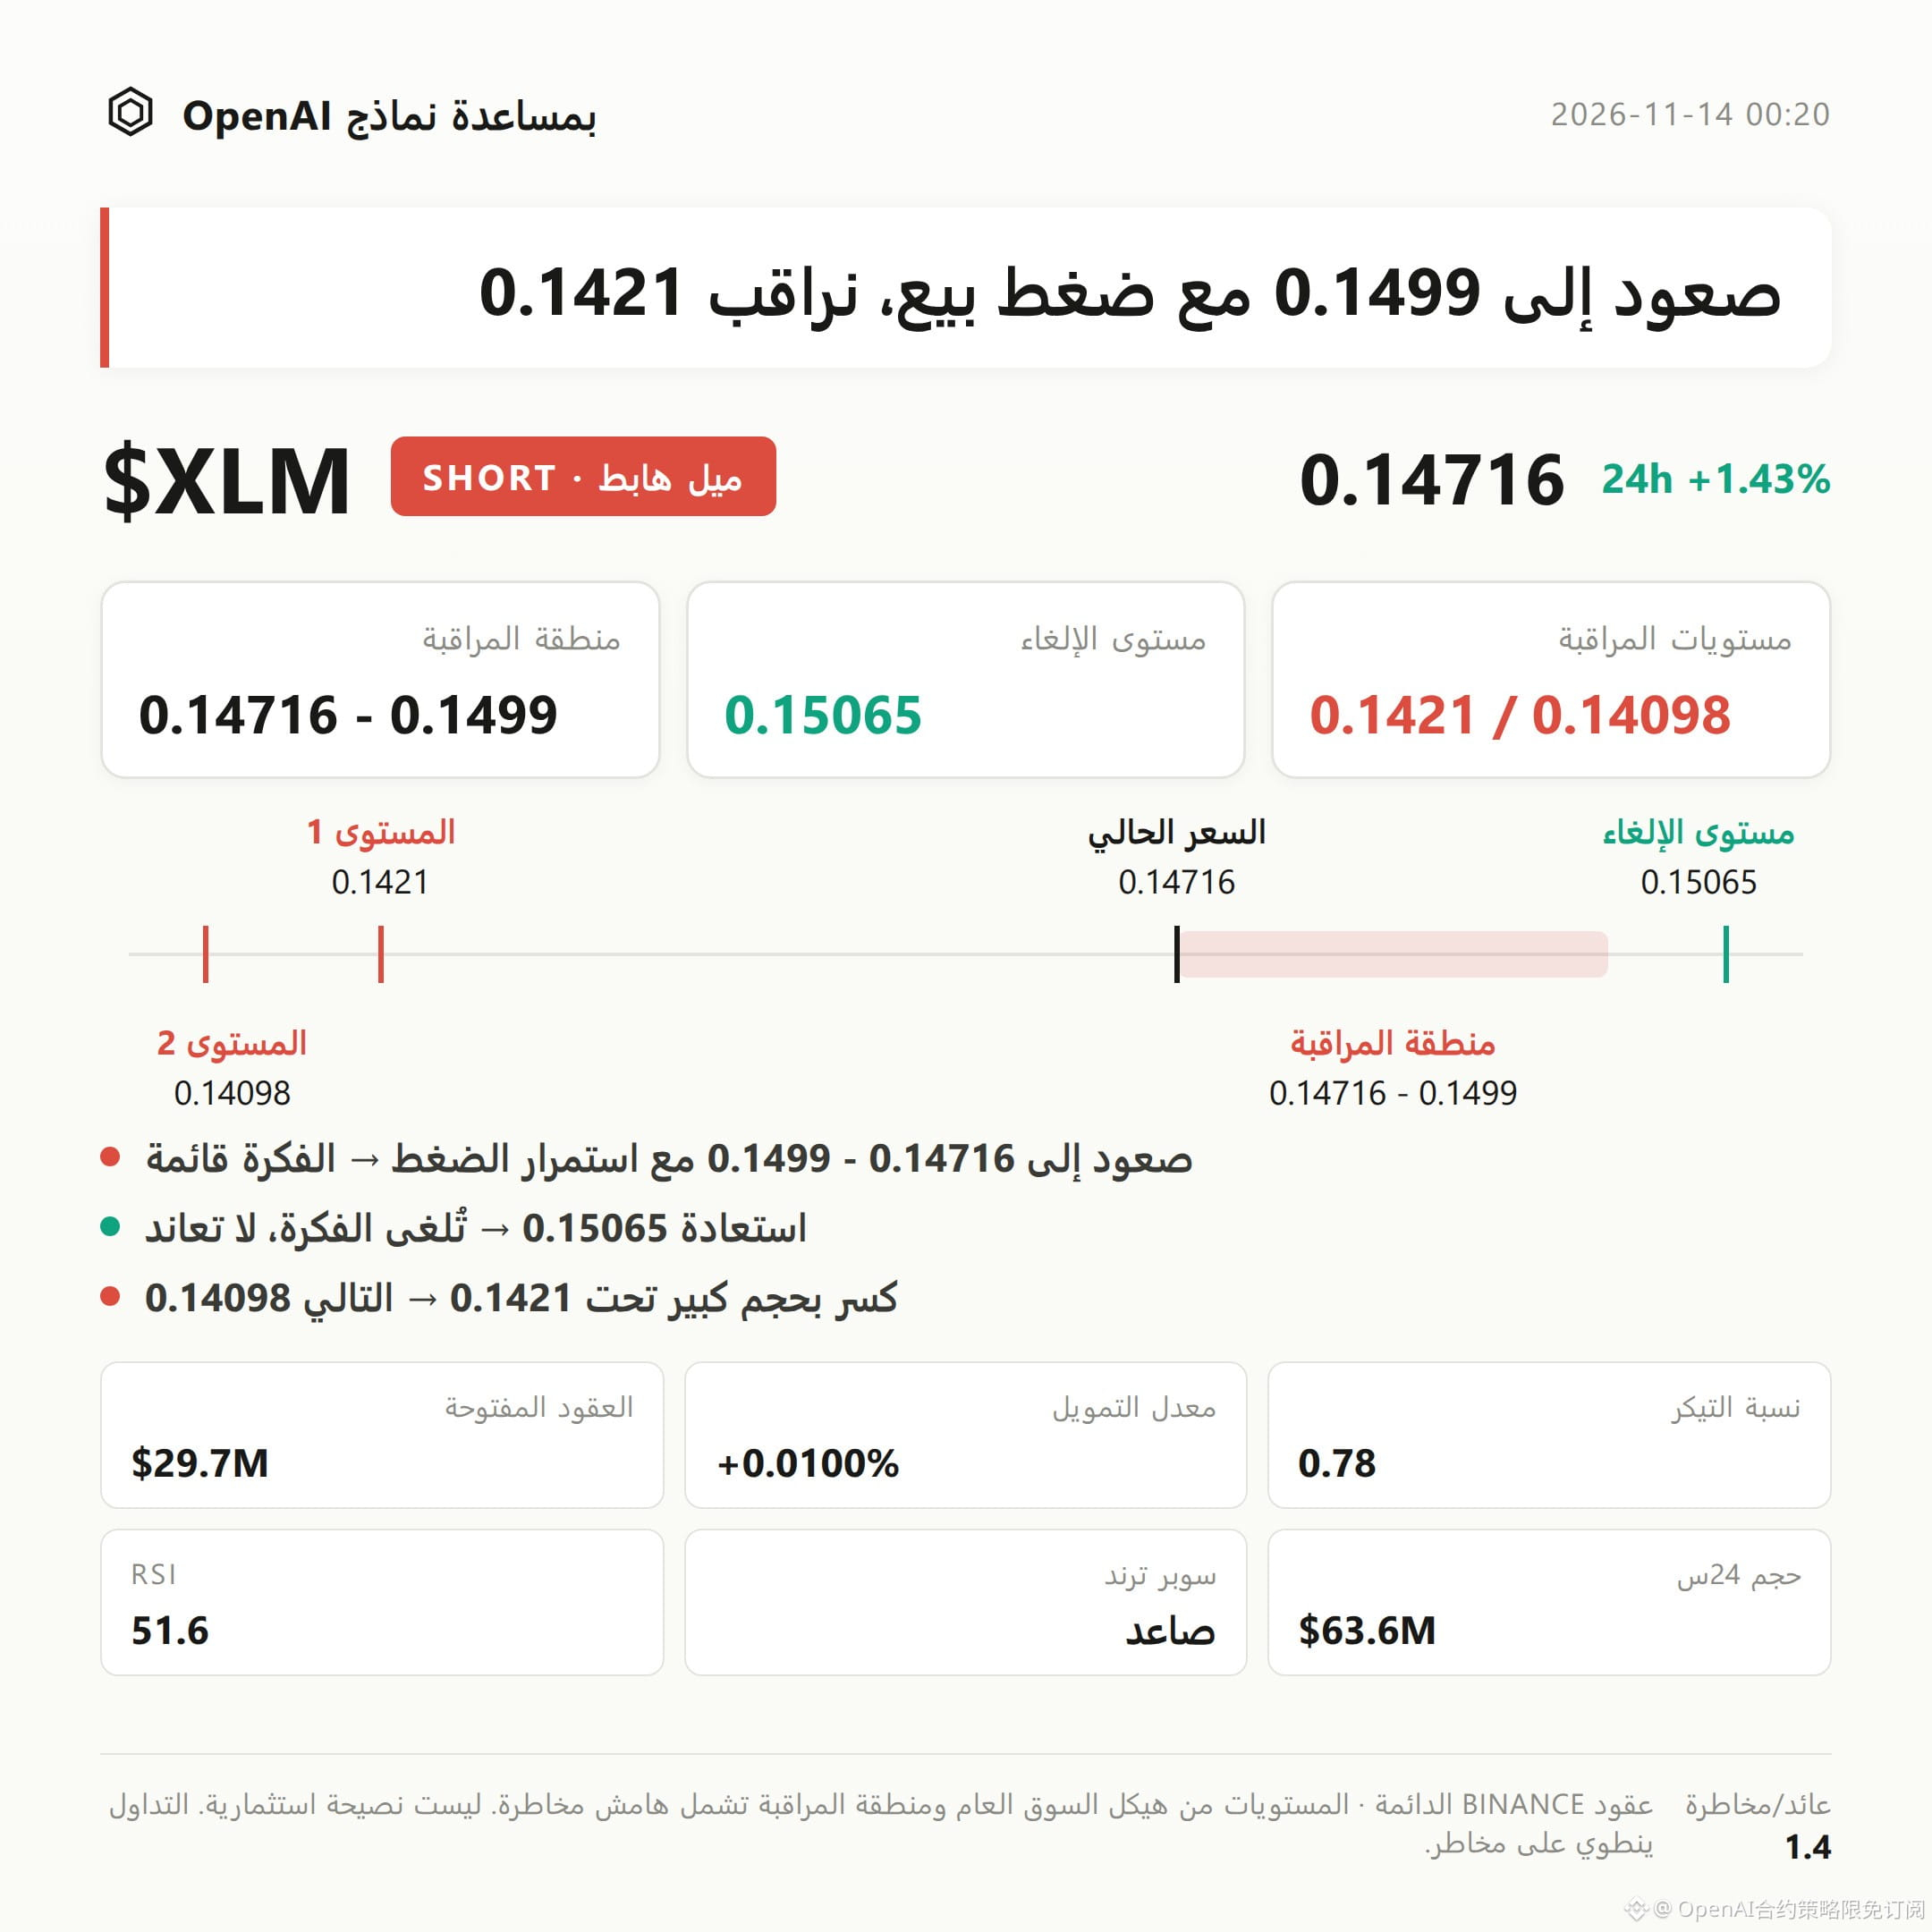
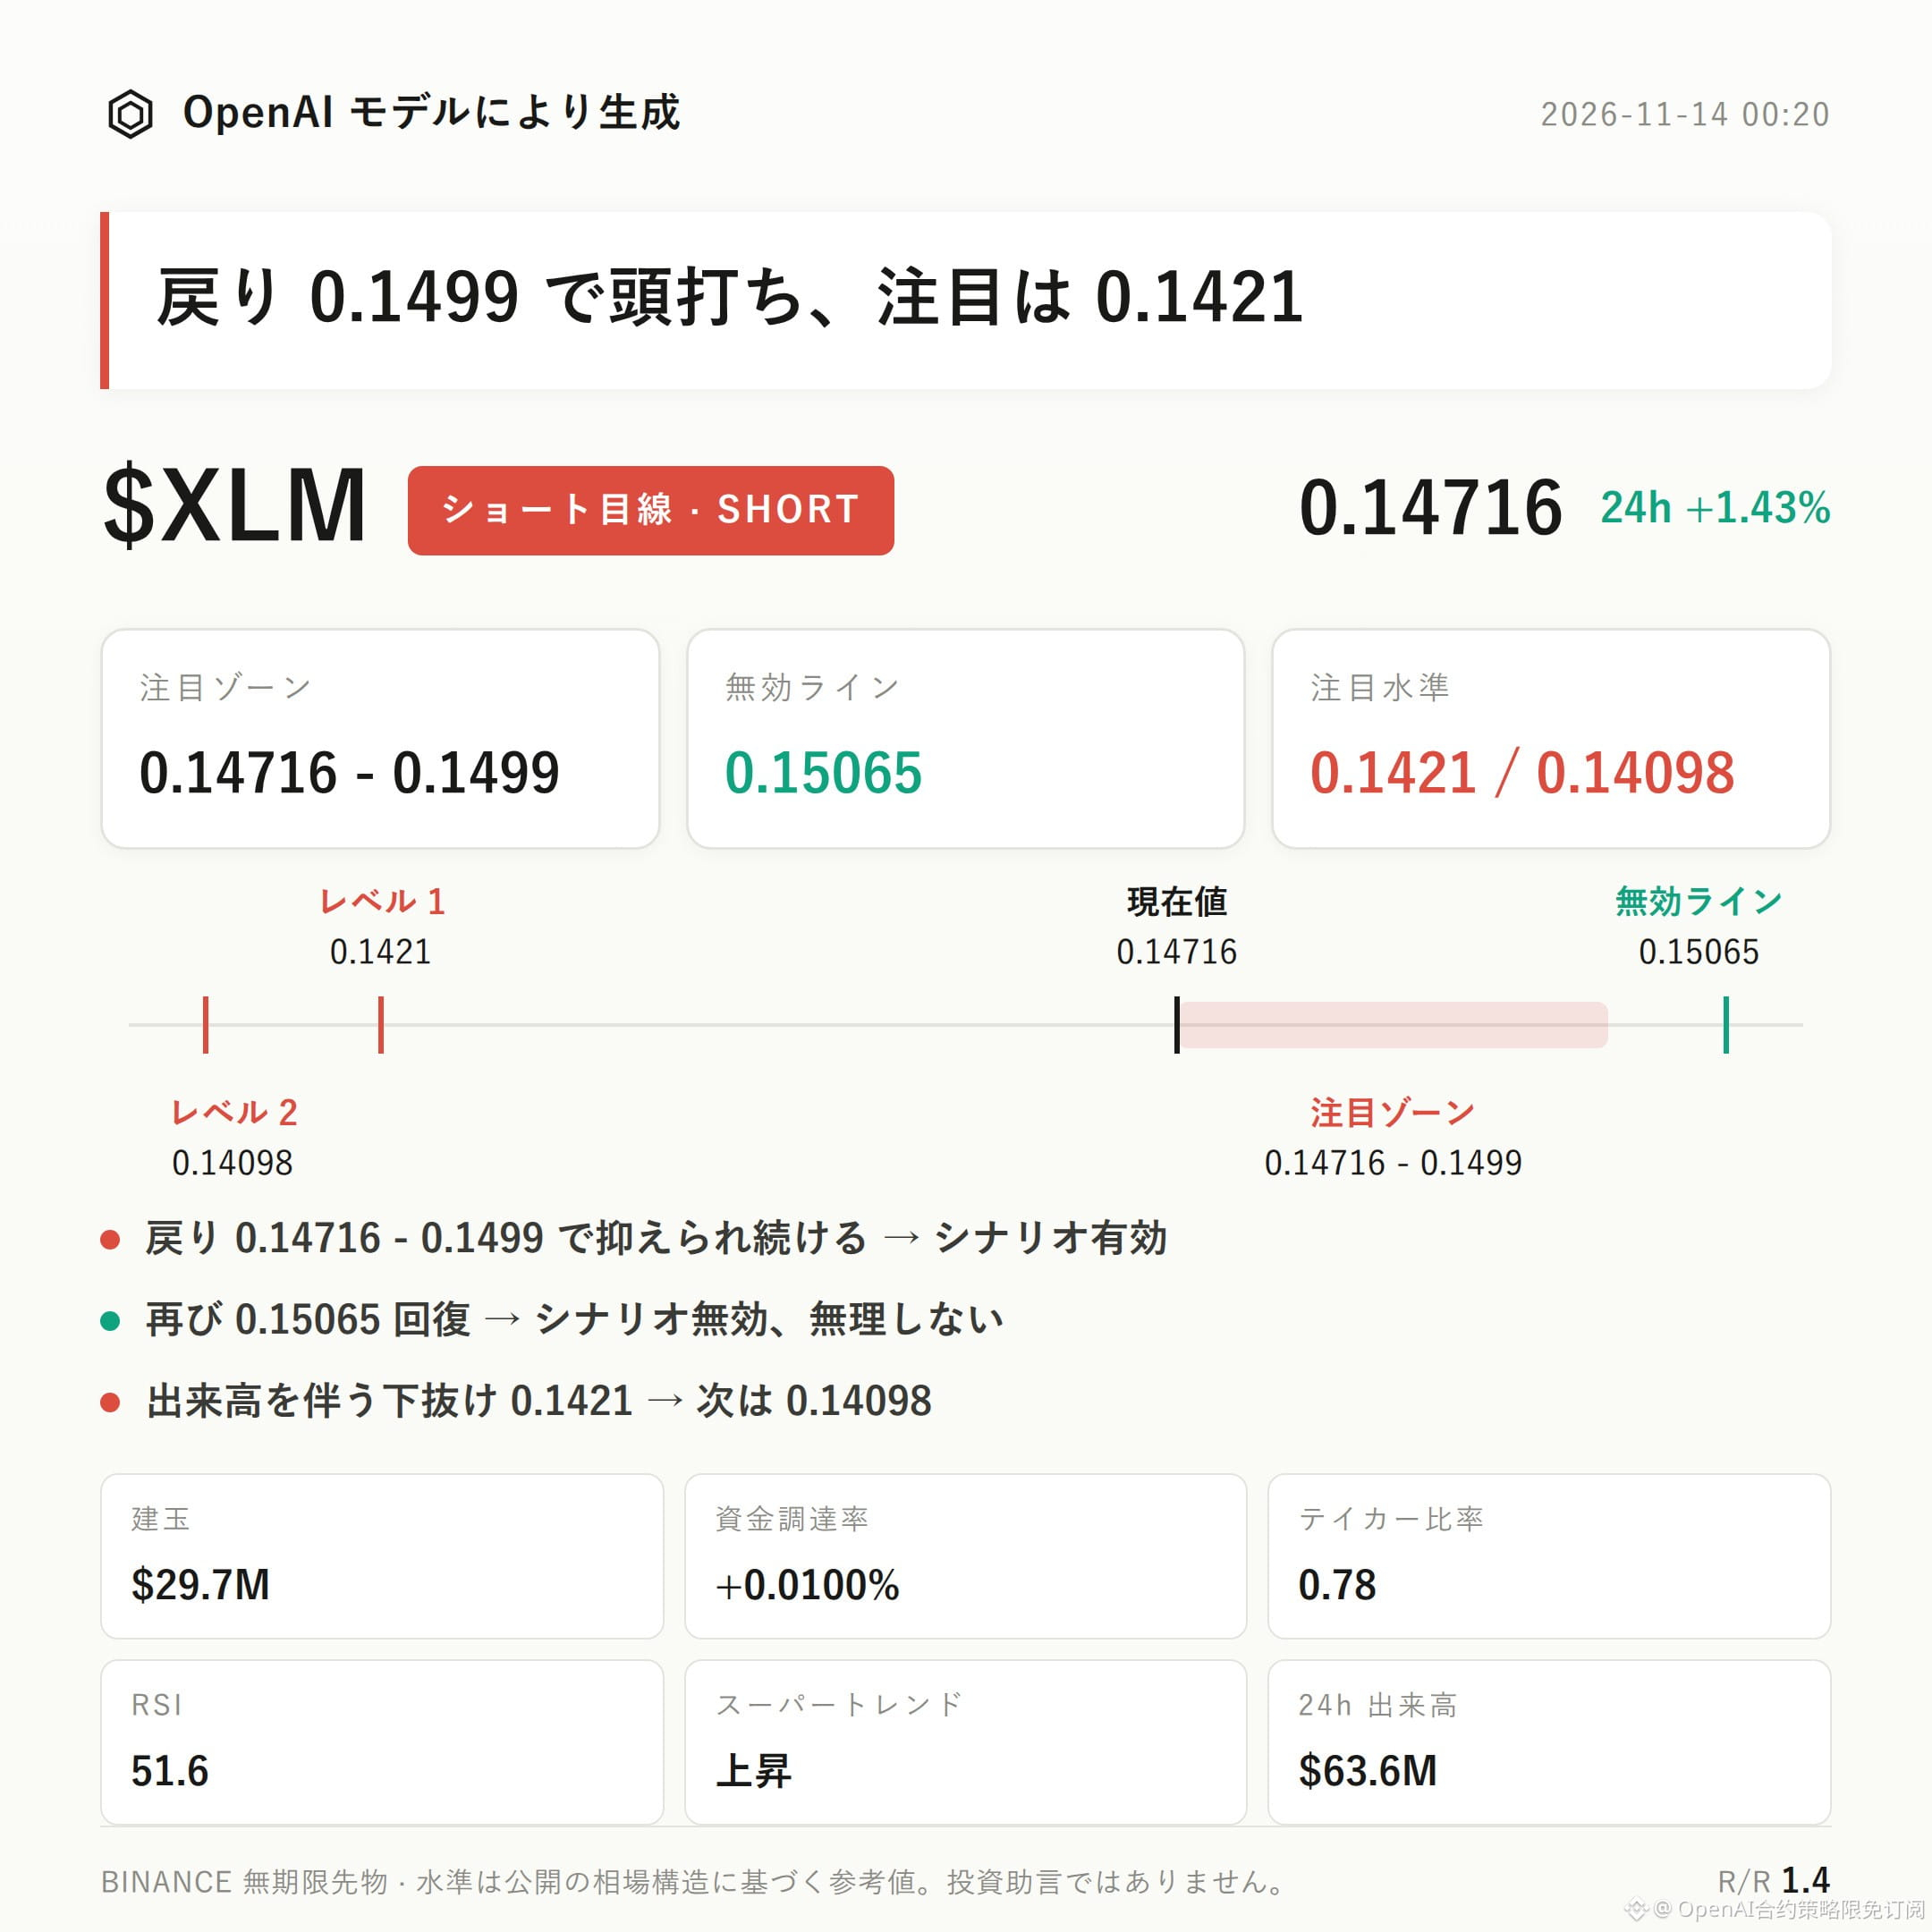
$XLM Bearish bias | Watch zone 0.14716 - 0.1499 | Invalidation reference 0.15065 | Levels to watch 0.1421 / 0.14098
$XLM The current structure is leaning bearish.
The key factor is that the taker buy/sell ratio of 0.78 shows taker selling dominance. Meanwhile, the funding rate is +0.0100% and 58% of accounts are long, indicating some crowding on the long side.
The main thing to watch is whether a rebound is capped in the 0.14716 - 0.1499 resistance zone, with continued confirmation from taker selling.
The technical picture is not uniformly bearish: the current price of 0.14716 remains above the Bollinger middle band at 0.1466, the Supertrend remains upward, and MACD also shows bullish momentum.
RSI is 51.6, which does not yet provide clear confirmation of one-sided weakness.
The upper Bollinger Band at 0.1511 and the recent high of 0.15065 serve as resistance references. The bearish thesis depends more on a rejected rebound than on directly chasing a decline.
The 24-hour gain is +1.43%, trading volume is 63.56 million, and open interest is 29.72 million, up 0.5% over 24 hours.
While the price has risen and open interest has edged up, the taker buy/sell ratio is only 0.78, indicating that taker sellers still dominate among new positions.
The positive funding rate and 58% long-account share also make the risk of a pullback after long-side crowding worth watching.
The bearish thesis is confirmed only if a rebound to 0.14716 - 0.1499 fails to attract sustained buying and shows renewed resistance.
If the price reclaims the 0.15065 invalidation reference, the current pullback structure is broken and the bearish thesis is invalidated; it will not be maintained.
If price breaks below the first level to watch at 0.1421 on increased volume, the next support to watch is around 0.14098.
The reference risk/reward ratio is 1.4 and is only used to assess the relationship between these price levels.
There is currently no significant reversal breakout signal above the recent high, but the upward Supertrend, bullish MACD momentum, and price remaining above the Bollinger middle band are all countervailing evidence that must be taken into account.
Leverage itself carries risk; position discipline is more important than directional judgment.
For reference only; this is not investment advice. Contracts use leverage, and investing involves risk.
This article was generated with the assistance of an OpenAI large language model.
$XLM #Contract Analysis
$XLM Bearish bias | Watch zone 0.14716 - 0.1499 | Invalidation reference 0.15065 | Levels to watch 0.1421 / 0.14098
$XLM The current structure is leaning bearish.
The key factor is that the taker buy/sell ratio of 0.78 shows taker selling dominance. Meanwhile, the funding rate is +0.0100% and 58% of accounts are long, indicating some crowding on the long side.
The main thing to watch is whether a rebound is capped in the 0.14716 - 0.1499 resistance zone, with continued confirmation from taker selling.
The technical picture is not uniformly bearish: the current price of 0.14716 remains above the Bollinger middle band at 0.1466, the Supertrend remains upward, and MACD also shows bullish momentum.
RSI is 51.6, which does not yet provide clear confirmation of one-sided weakness.
The upper Bollinger Band at 0.1511 and the recent high of 0.15065 serve as resistance references. The bearish thesis depends more on a rejected rebound than on directly chasing a decline.
The 24-hour gain is +1.43%, trading volume is 63.56 million, and open interest is 29.72 million, up 0.5% over 24 hours.
While the price has risen and open interest has edged up, the taker buy/sell ratio is only 0.78, indicating that taker sellers still dominate among new positions.
The positive funding rate and 58% long-account share also make the risk of a pullback after long-side crowding worth watching.
The bearish thesis is confirmed only if a rebound to 0.14716 - 0.1499 fails to attract sustained buying and shows renewed resistance.
If the price reclaims the 0.15065 invalidation reference, the current pullback structure is broken and the bearish thesis is invalidated; it will not be maintained.
If price breaks below the first level to watch at 0.1421 on increased volume, the next support to watch is around 0.14098.
The reference risk/reward ratio is 1.4 and is only used to assess the relationship between these price levels.
There is currently no significant reversal breakout signal above the recent high, but the upward Supertrend, bullish MACD momentum, and price remaining above the Bollinger middle band are all countervailing evidence that must be taken into account.
Leverage itself carries risk; position discipline is more important than directional judgment.
For reference only; this is not investment advice. Contracts use leverage, and investing involves risk.
This article was generated with the assistance of an OpenAI large language model.
$XLM #Contract Analysis