
#bitcoinbreaksbelow200weekmovingaverage
🚨 Bitcoin $BTC Breaks Below the 200-Week Moving Average: A Critical Warning? 📉
Imagine watching Bitcoin survive multiple market crashes, only to see it approach one of its most important long-term support levels again. This is where market confidence gets tested.
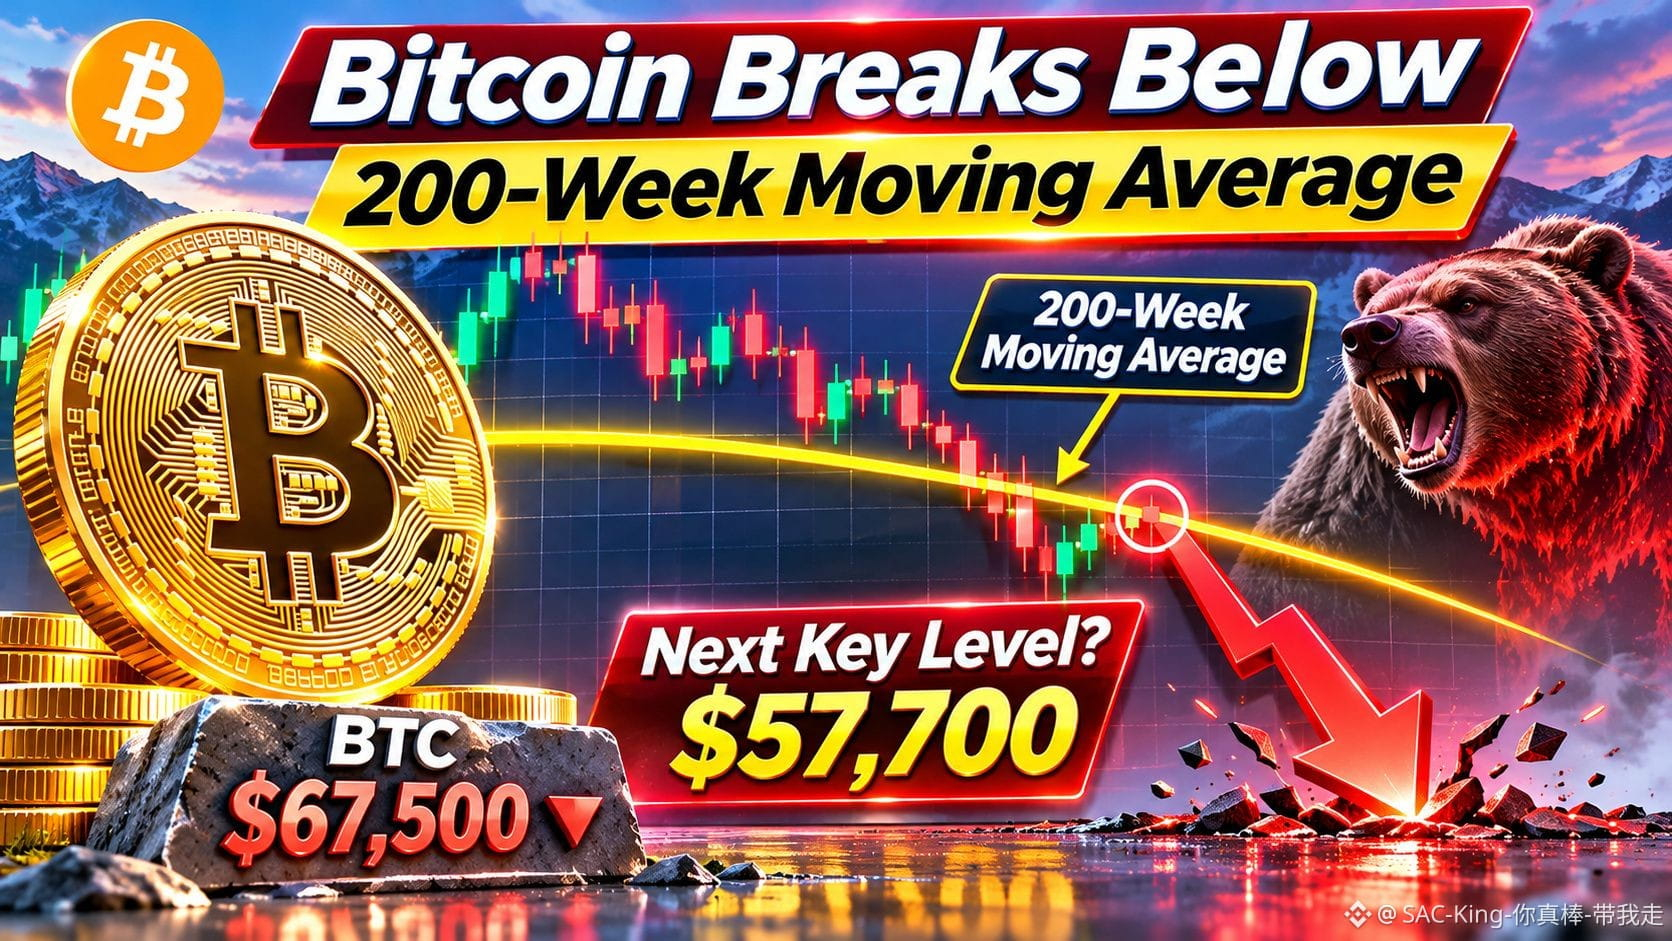
On November 13, Bitcoin slipped below the 200-week Simple Moving Average (SMA), trading near $67,500 as the long-term trend line hovered around $68,000.
This matters because the 200-week moving average has historically served as an important reference point during major Bitcoin market downturns.
But here's the detail many traders overlook: touching or briefly breaking this level is not the same as confirming a long-term breakdown. The weekly candle close will carry much greater significance.
External pressure is also building. Rising US Treasury yields, a stronger dollar, and weakness across technology markets are making risk-sensitive assets less attractive.
If Bitcoin fails to reclaim the $68,000 region, sellers could gain further control. Some analysts are watching $57,700 as a potential downside area if weekly momentum deteriorates further.
However, a recovery above this moving average could turn today's breakdown into a temporary liquidity shakeout.
My view: Don't rush to call the bottom or declare a bear market. Watch the weekly close, trading volume, and whether buyers defend the next support zone.
Bitcoin's next weekly candle could tell us more than a hundred bullish or bearish headlines.
Will BTC reclaim its 200-week moving average, or are we entering a deeper correction?
Disclaimer: Educational content only. Not financial advice.
#Bitcoin #CryptoMarket #GrowWithSAC $CBRSB $HUMA
#BitcoinBreaksBelow200WeekMovingAverage
🚨 Bitcoin $BTC Breaks Below the 200-Week Moving Average: A Critical Warning? 📉
Imagine watching Bitcoin survive multiple market crashes, only to see it approach one of its most important long-term support levels again. This is where market confidence gets tested.
On November 13, Bitcoin slipped below the 200-week Simple Moving Average (SMA), trading near $67,500 as the long-term trend line hovered around $68,000.
This matters because the 200-week moving average has historically served as an important reference point during major Bitcoin market downturns.
But here's the detail many traders overlook: touching or briefly breaking this level is not the same as confirming a long-term breakdown. The weekly candle close will carry much greater significance.
External pressure is also building. Rising US Treasury yields, a stronger dollar, and weakness across technology markets are making risk-sensitive assets less attractive.
If Bitcoin fails to reclaim the $68,000 region, sellers could gain further control. Some analysts are watching $57,700 as a potential downside area if weekly momentum deteriorates further.
However, a recovery above this moving average could turn today's breakdown into a temporary liquidity shakeout.
My view: Don't rush to call the bottom or declare a bear market. Watch the weekly close, trading volume, and whether buyers defend the next support zone.
Bitcoin's next weekly candle could tell us more than a hundred bullish or bearish headlines.
Will BTC reclaim its 200-week moving average, or are we entering a deeper correction?
Disclaimer: Educational content only. Not financial advice.
#Bitcoin #CryptoMarket #GrowWithSAC $CBRSB $HUMA
#BitcoinBreaksBelow200WeekMovingAverage