$AKE USDT | 23:06 13/11/2026
■ 1. Price structure
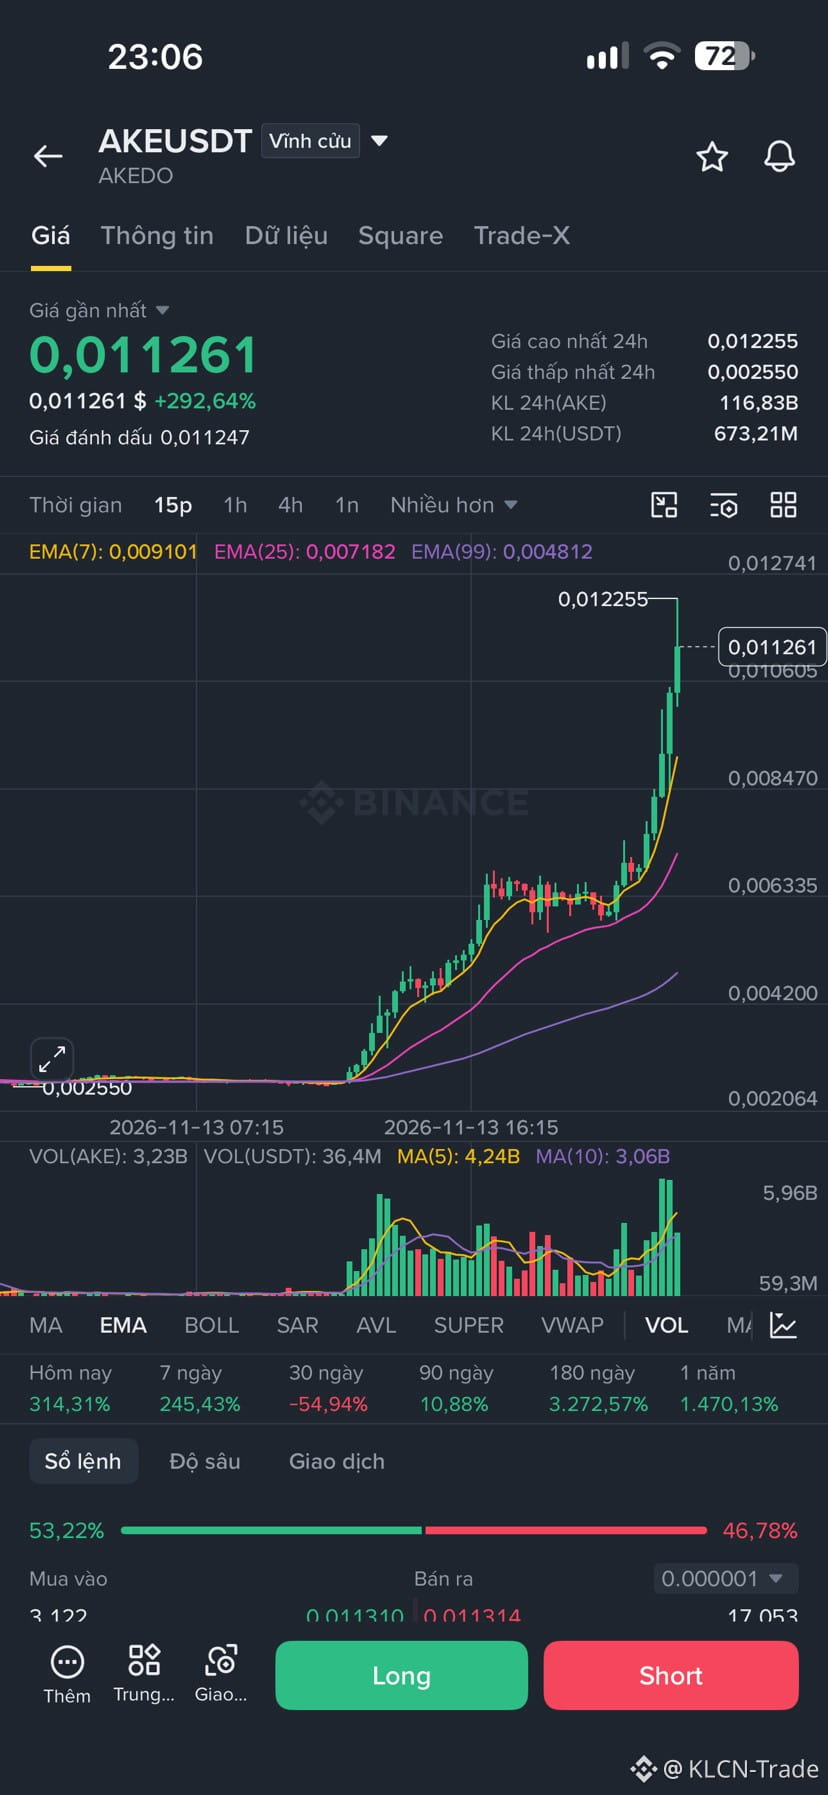
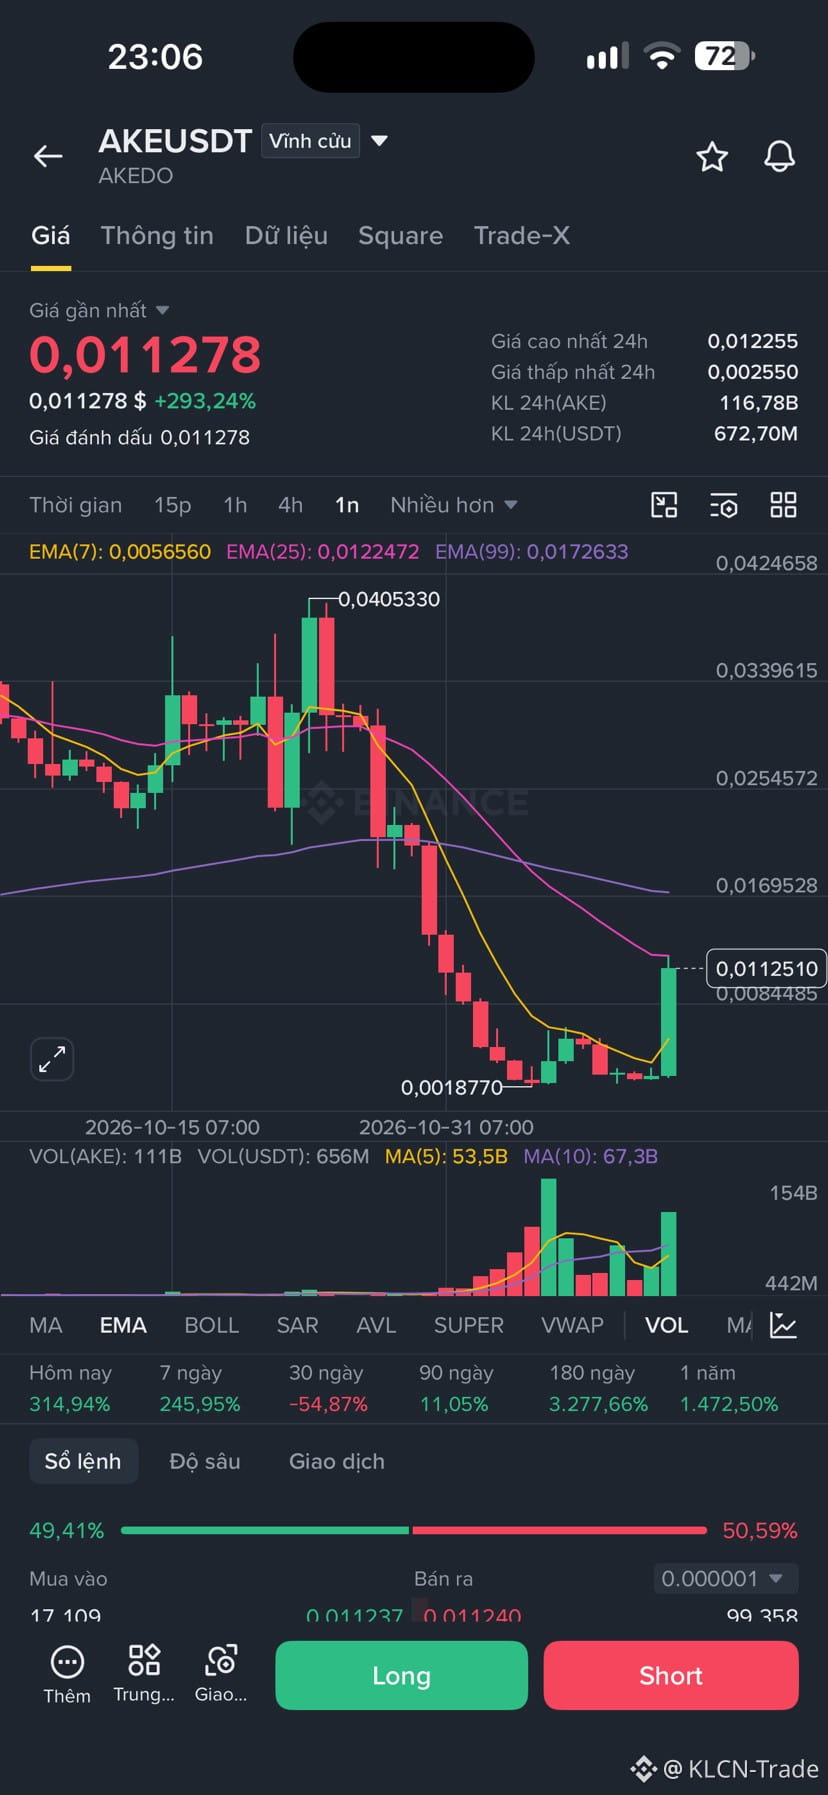
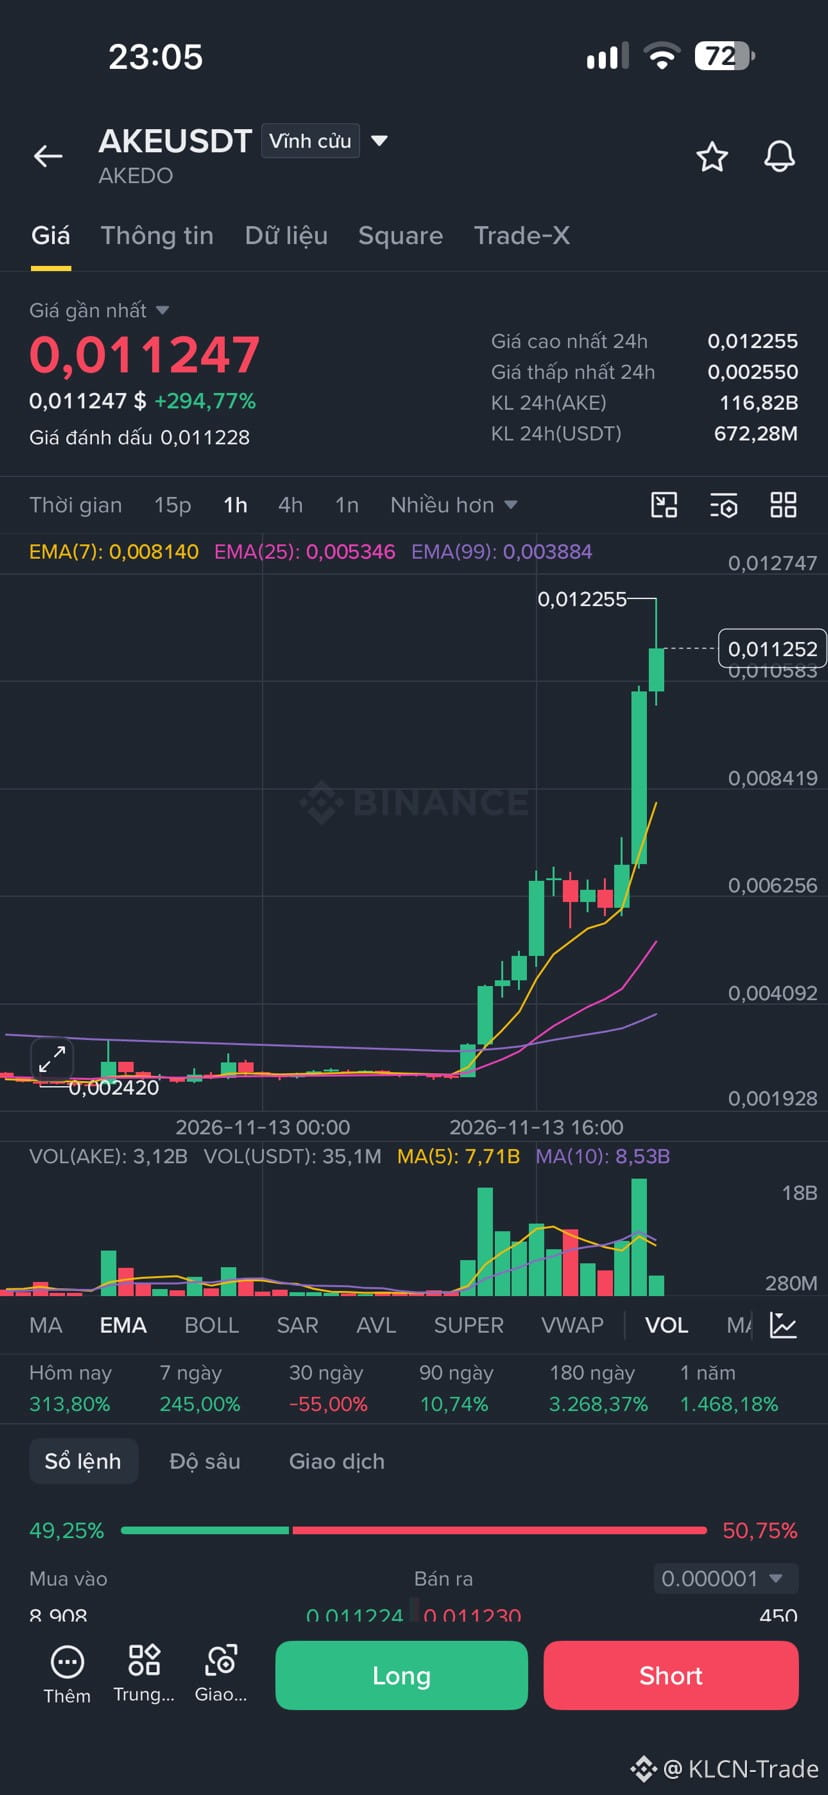
Price 0.011261, up 292% in 24h, volume 673M USDT. Up 4.8x from the low of 0.00255. The 15m–1h charts are strongly bullish, EMA7>EMA25>EMA99. But the daily chart is still in a downtrend: EMA7 0.0056 < EMA25 0.0122 < EMA99 0.0172. Down 54.94% over 30 days. This is a technical rebound after a 95% drop from the 0.0405 high.
■ 2. Main risks
1) No nearby support: Gap from 0.0025 to 0.012. The first solid support is EMA7 on the 15m chart at 0.0091 = -19%; EMA7 on the 1h chart at 0.0081 = -28%.
2) Profit-taking pressure: Up 245% in 7 days; those who bought the bottom at 0.0025 are up 4.5x. The daily chart touched EMA25 at 0.0122 and was immediately sold off.
3) Long/short balanced at 49/51 on the daily chart: No extreme FOMO yet, but there is also no overwhelming influx of new buying.
■ 3. Key levels
• Resistance: 0.012255, 24h high. A breakout would open the way to 0.0169, the daily EMA99.
• Support 1: A break below 0.0106 could send price to 0.0091 = -19%.
• Support 2: A break below 0.0081 could send price to 0.0071, the 15m EMA25 = -37%.
• Support 3: 0.0053, the 1h EMA25 = -53%.
• Low: A break below 0.00255 could send price to 0.00187 = -83%.
■ 4. Preferred scenarios
70% probability – Deep correction over the next 24–48h: A 5x pump is usually followed by a 40%–60% dump. Targets: 0.0081, then 0.0053. Reasons: long upper wick + 18B AKE in sell volume + daily chart touching EMA25.
20% probability – Sideways between 0.009 and 0.012: Accumulation for 2–3 days, then a directional move.
10% probability – Break above 0.0122 toward 0.017: Requires a daily close above EMA25 at 0.0122 with volume >150B.
■ 5. Trading plan
• Holding a position: Take profit on 70–80% in the 0.0112–0.0122 zone. Stop-loss at 0.0106; sell everything if it breaks below.
• No position yet: Don't FOMO. Consider allocating only 5% of capital if price reaches 0.0081, and another 5% if it reaches 0.0053.
• Risk/reward ratio: Buy at 0.011, target 0.017 for a 54% gain; downside to 0.0053 is a 53% loss. Not attractive.
■ 1. Price structure
Price 0.011261, up 292% in 24h, volume 673M USDT. Up 4.8x from the low of 0.00255. The 15m–1h charts are strongly bullish, EMA7>EMA25>EMA99. But the daily chart is still in a downtrend: EMA7 0.0056 < EMA25 0.0122 < EMA99 0.0172. Down 54.94% over 30 days. This is a technical rebound after a 95% drop from the 0.0405 high.
■ 2. Main risks
1) No nearby support: Gap from 0.0025 to 0.012. The first solid support is EMA7 on the 15m chart at 0.0091 = -19%; EMA7 on the 1h chart at 0.0081 = -28%.
2) Profit-taking pressure: Up 245% in 7 days; those who bought the bottom at 0.0025 are up 4.5x. The daily chart touched EMA25 at 0.0122 and was immediately sold off.
3) Long/short balanced at 49/51 on the daily chart: No extreme FOMO yet, but there is also no overwhelming influx of new buying.
■ 3. Key levels
• Resistance: 0.012255, 24h high. A breakout would open the way to 0.0169, the daily EMA99.
• Support 1: A break below 0.0106 could send price to 0.0091 = -19%.
• Support 2: A break below 0.0081 could send price to 0.0071, the 15m EMA25 = -37%.
• Support 3: 0.0053, the 1h EMA25 = -53%.
• Low: A break below 0.00255 could send price to 0.00187 = -83%.
■ 4. Preferred scenarios
70% probability – Deep correction over the next 24–48h: A 5x pump is usually followed by a 40%–60% dump. Targets: 0.0081, then 0.0053. Reasons: long upper wick + 18B AKE in sell volume + daily chart touching EMA25.
20% probability – Sideways between 0.009 and 0.012: Accumulation for 2–3 days, then a directional move.
10% probability – Break above 0.0122 toward 0.017: Requires a daily close above EMA25 at 0.0122 with volume >150B.
■ 5. Trading plan
• Holding a position: Take profit on 70–80% in the 0.0112–0.0122 zone. Stop-loss at 0.0106; sell everything if it breaks below.
• No position yet: Don't FOMO. Consider allocating only 5% of capital if price reaches 0.0081, and another 5% if it reaches 0.0053.
• Risk/reward ratio: Buy at 0.011, target 0.017 for a 54% gain; downside to 0.0053 is a 53% loss. Not attractive.