$HYPE remains one of the most resilient high-performance assets in the DeFi sector, yet it is currently locked in a critical technical struggle that will define its medium-term trajectory. While demonstrating strong fundamental utility, the price is compressed within a classic descending channel, battling persistent selling pressure.
Technical Snapshot: Crucial Levels
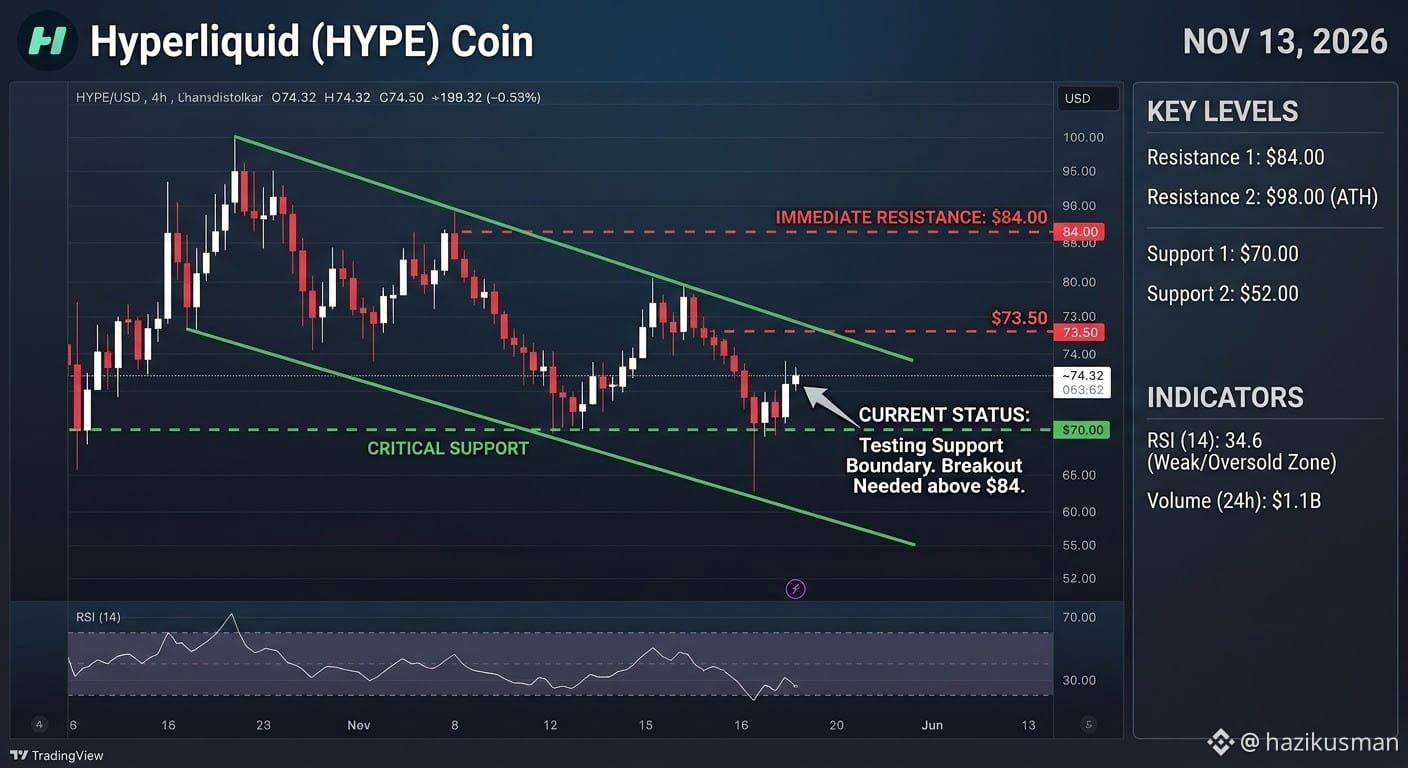
Price & Support Struggle: As of November 13, 2026, HYPE is trading approximately at $74.32, staging a shallow intraday recovery. The asset is fighting to maintain its position above the vital $70 psychological support level. This boundary must hold to prevent a steeper correction.
Descending Momentum: The chart reveals a series of lower highs and lower lows. A critical descending resistance line (top green line on the chart) currently caps all breakout attempts.
Resistance Zones: The immediate hurdle is $73.50. However, the major 'bullish confirmation' level sits higher, at $84.00. A decisive daily close above $84 would invalidate the descending channel and signal a potent reversal.
Indicators: The 14-period RSI is near 34.6, hovering just above the oversold region. This suggests that while selling pressure has been dominant, momentum is stretched, and a "relief bounce" or short squeeze could materialize if buyers defend $70 aggressively.
Technical Snapshot: Crucial Levels
Price & Support Struggle: As of November 13, 2026, HYPE is trading approximately at $74.32, staging a shallow intraday recovery. The asset is fighting to maintain its position above the vital $70 psychological support level. This boundary must hold to prevent a steeper correction.
Descending Momentum: The chart reveals a series of lower highs and lower lows. A critical descending resistance line (top green line on the chart) currently caps all breakout attempts.
Resistance Zones: The immediate hurdle is $73.50. However, the major 'bullish confirmation' level sits higher, at $84.00. A decisive daily close above $84 would invalidate the descending channel and signal a potent reversal.
Indicators: The 14-period RSI is near 34.6, hovering just above the oversold region. This suggests that while selling pressure has been dominant, momentum is stretched, and a "relief bounce" or short squeeze could materialize if buyers defend $70 aggressively.