
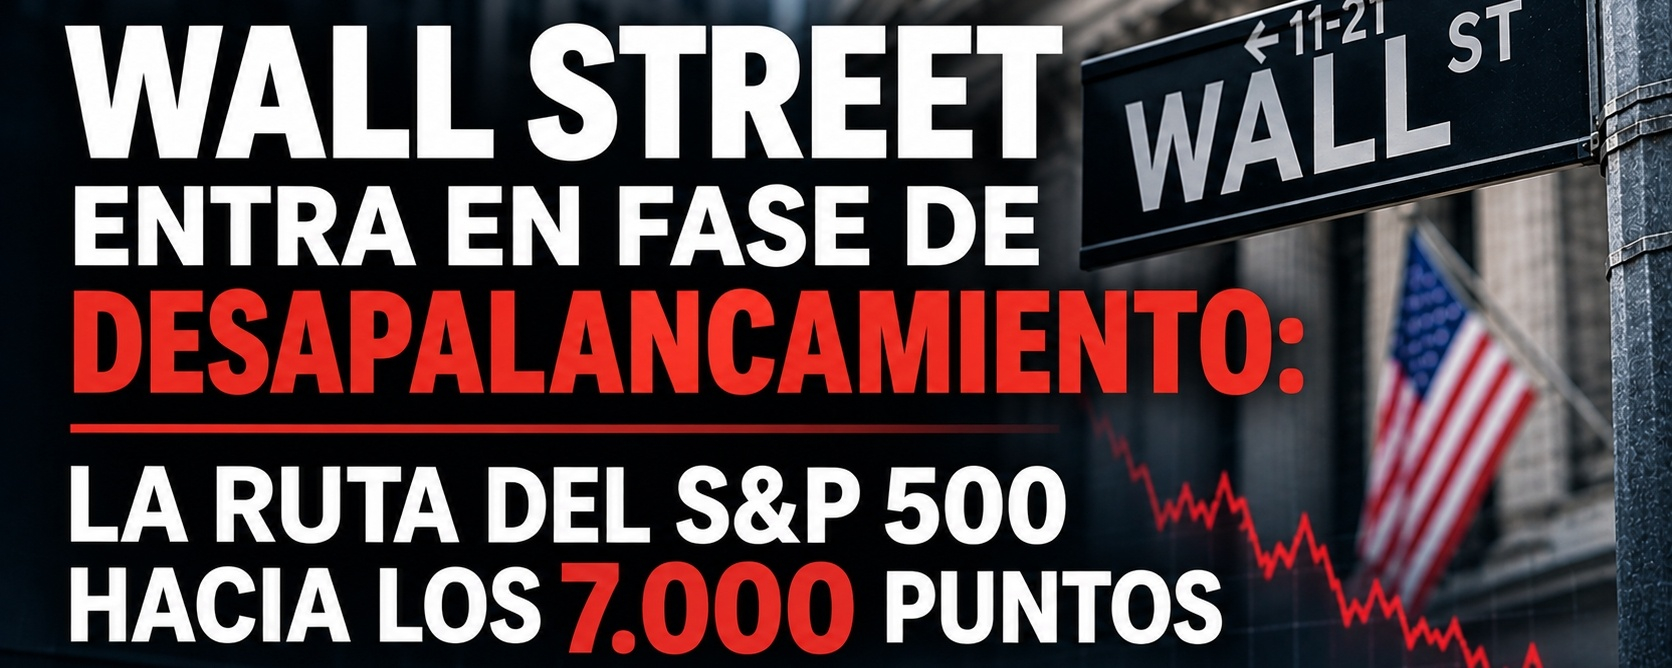

The week closes with a convergence of factors confirming that large portfolios are structurally reducing risk. Today, Friday, October’s U.S. Producer Price Index (PPI) has joined the sudden change at the top of NVIDIA, operational failures in Microsoft’s cloud services, and hedge funds’ reduced exposure.
1. What October’s PPI showed today, Friday, and why the bond yield remains above 5.1%:
In my previous analysis, I outlined three scenarios for the PPI. The official figures released today confirm that pressure in the production chain has not disappeared:
- The headline PPI rose 0.3% month over month (a tenth of a percentage point below the expected 0.4% thanks to a one-off drop in diesel, but with September’s figure revised up from 1.3% to 1.4%).
- Year over year, the PPI climbed from 6.3% to 6.5%, its highest level since November 2022.
- Core PPI matched the estimated 0.3% monthly increase (5.0% year over year), while the measure excluding food, energy, and trade margins rose 0.5% month over month (4.9% year over year), driven by a 0.5% increase in core goods.
With the CPI already surprising to the upside this week and the PPI at 6.5% annually, the 10-year Treasury yield remains above the 5.1% threshold, the dollar is still at a 19-month high, and Bitcoin ($BTC) remains under pressure below $70,000.
2. NVIDIA, Microsoft, and AI’s financial ecosystem under scrutiny:
Jensen Huang’s immediate departure as NVIDIA’s ($NVDA) CEO, with CFO Colette Kress taking over on an interim basis, triggered initial losses of nearly 12% on Thursday as some of the flow sought tactical refuge in AMD ($AMD) and Broadcom ($AVGO). Beyond the leadership change, on November 17, when NVIDIA reports quarterly results, the market will scrutinize the sustainability of the cycle of investments and cross-purchases among chip suppliers, cloud providers, and AI developers, now that credit costs exceed 5%. Meanwhile, the global Microsoft 365 ($MSFT) outage caused by server overload highlights the ongoing CapEx demands of this infrastructure.
3. Mechanical selling by hedge funds:
Institutional filings explain why rebounds fizzle quickly. According to Goldman Sachs, fundamental long/short funds fell 3.5% in October and systematic funds fell 3.6%, executing the largest net liquidation of long positions in seven months and reducing their net leverage to 73.4%. According to Morgan Stanley, gross long/short exposure has contracted 10.7% since the end of June—the biggest deleveraging in more than ten years.
4. Order flow and technical map for the S&P 500 heading toward 7,000 points:
After closing yesterday at 7,592.40 points, any initial tactical rebound today following the PPI’s 0.3% monthly increase should be viewed through an institutional lens: when funds cut gross exposure due to risk limits, they use rallies into supply zones to unload inventory without driving down their own exit price.
- Immediate first level to watch: 7,500 points.
- Key structural support: the 7,350–7,400-point range.
- Liquidity target: If the market breaks below 7,350–7,400 points and subsequent rebounds fail, with lower highs and negative breadth, the technical path toward 7,000 points (a further decline of nearly 7.8%) will be clear.
Do you think the S&P 500 can hold 7,500 points, or will institutional deleveraging ultimately push the index toward the liquidity at 7,000?
$NVDA $MSFT $BTC #WallStreet #PPI #Trading #Macroeconomics #stockmarket