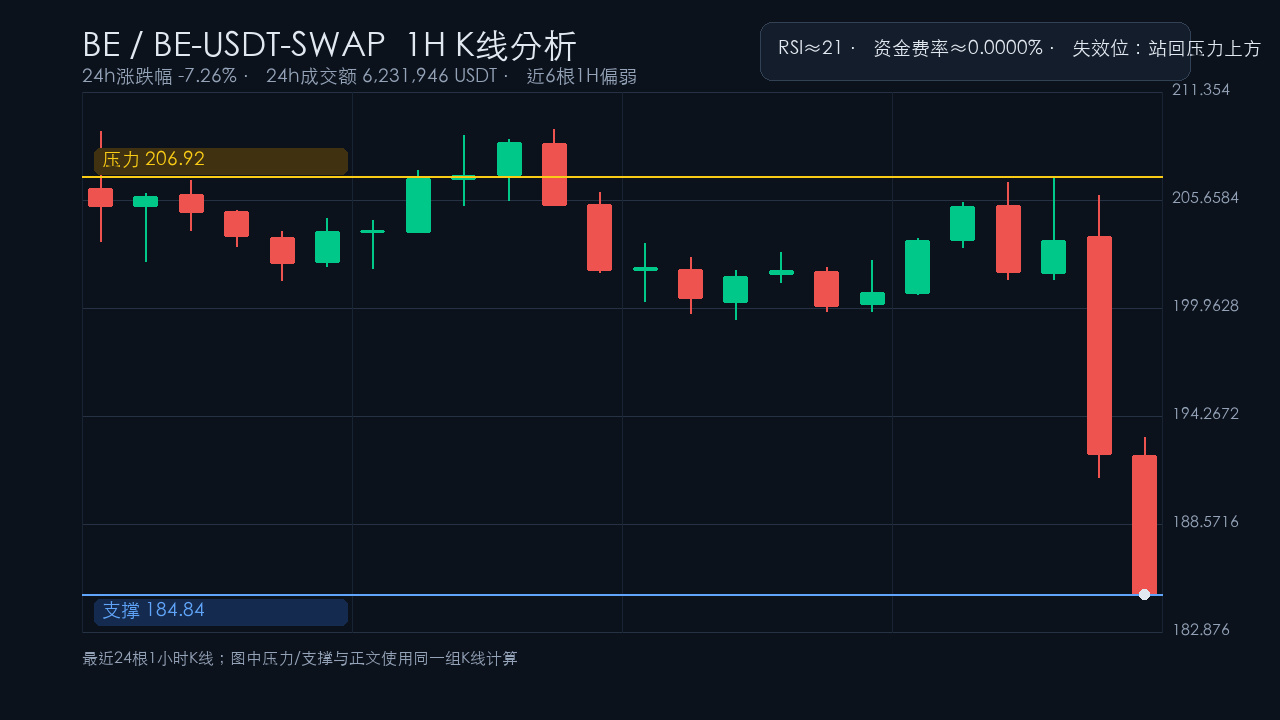

BE market activity has picked up, with 24-hour trading volume at about 6,231,946 USDT and a 24-hour change of about -7.26%. The 24-hour and recent 1-hour trends are currently aligned, both leaning weak. The last six 1-hour candlesticks are down about 9.18%. In this kind of market, it’s better to watch key levels rather than focus only on the percentage change.
On the 1-hour chart, the nearest resistance is at 206.92 and support is at 184.84. RSI is around 21, so a short-term oversold bounce is possible. The funding rate is about 0.0000%. If the price simply swings between these two levels, it suggests the market is still repricing; waiting for confirmation is steadier than chasing volatility.
Here’s what I’d watch: if the rebound can’t reclaim resistance, bears remain in control. If the price quickly recovers resistance, downside momentum may be fading. A high-volume break below support would warrant caution for further weakness; a move back above resistance would invalidate the bearish thesis.
My personal view: I care more about the quality of the rebound than whether the decline looks scary. If a bounce near resistance lacks volume, selling pressure remains overhead, and the weak structure hasn’t been resolved. A break below support would make the continuation of weakness clearer; if the price gets back above resistance, I’d have to admit that this outlook was wrong—don’t fight the market.
This is only a market observation, not a trade signal. The resistance and support levels shown on the chart use the same set of 1-hour candlesticks as the text. Until there’s confirmation from increased volume, position sizing and stop-losses matter more than directional predictions.
On the 1-hour chart, the nearest resistance is at 206.92 and support is at 184.84. RSI is around 21, so a short-term oversold bounce is possible. The funding rate is about 0.0000%. If the price simply swings between these two levels, it suggests the market is still repricing; waiting for confirmation is steadier than chasing volatility.
Here’s what I’d watch: if the rebound can’t reclaim resistance, bears remain in control. If the price quickly recovers resistance, downside momentum may be fading. A high-volume break below support would warrant caution for further weakness; a move back above resistance would invalidate the bearish thesis.
My personal view: I care more about the quality of the rebound than whether the decline looks scary. If a bounce near resistance lacks volume, selling pressure remains overhead, and the weak structure hasn’t been resolved. A break below support would make the continuation of weakness clearer; if the price gets back above resistance, I’d have to admit that this outlook was wrong—don’t fight the market.
This is only a market observation, not a trade signal. The resistance and support levels shown on the chart use the same set of 1-hour candlesticks as the text. Until there’s confirmation from increased volume, position sizing and stop-losses matter more than directional predictions.