📊 Technical Analysis: BMT/USDT — Reversal Opportunity or Bull Trap?
The BMT/USDT pair is showing a very interesting chart setup on the short-term timeframes (15m and 4h), with a strong buying reaction after testing crucial support zones. Below is a complete X-ray of the asset to post in your feed:
🔍 Chart Overview and Indicators
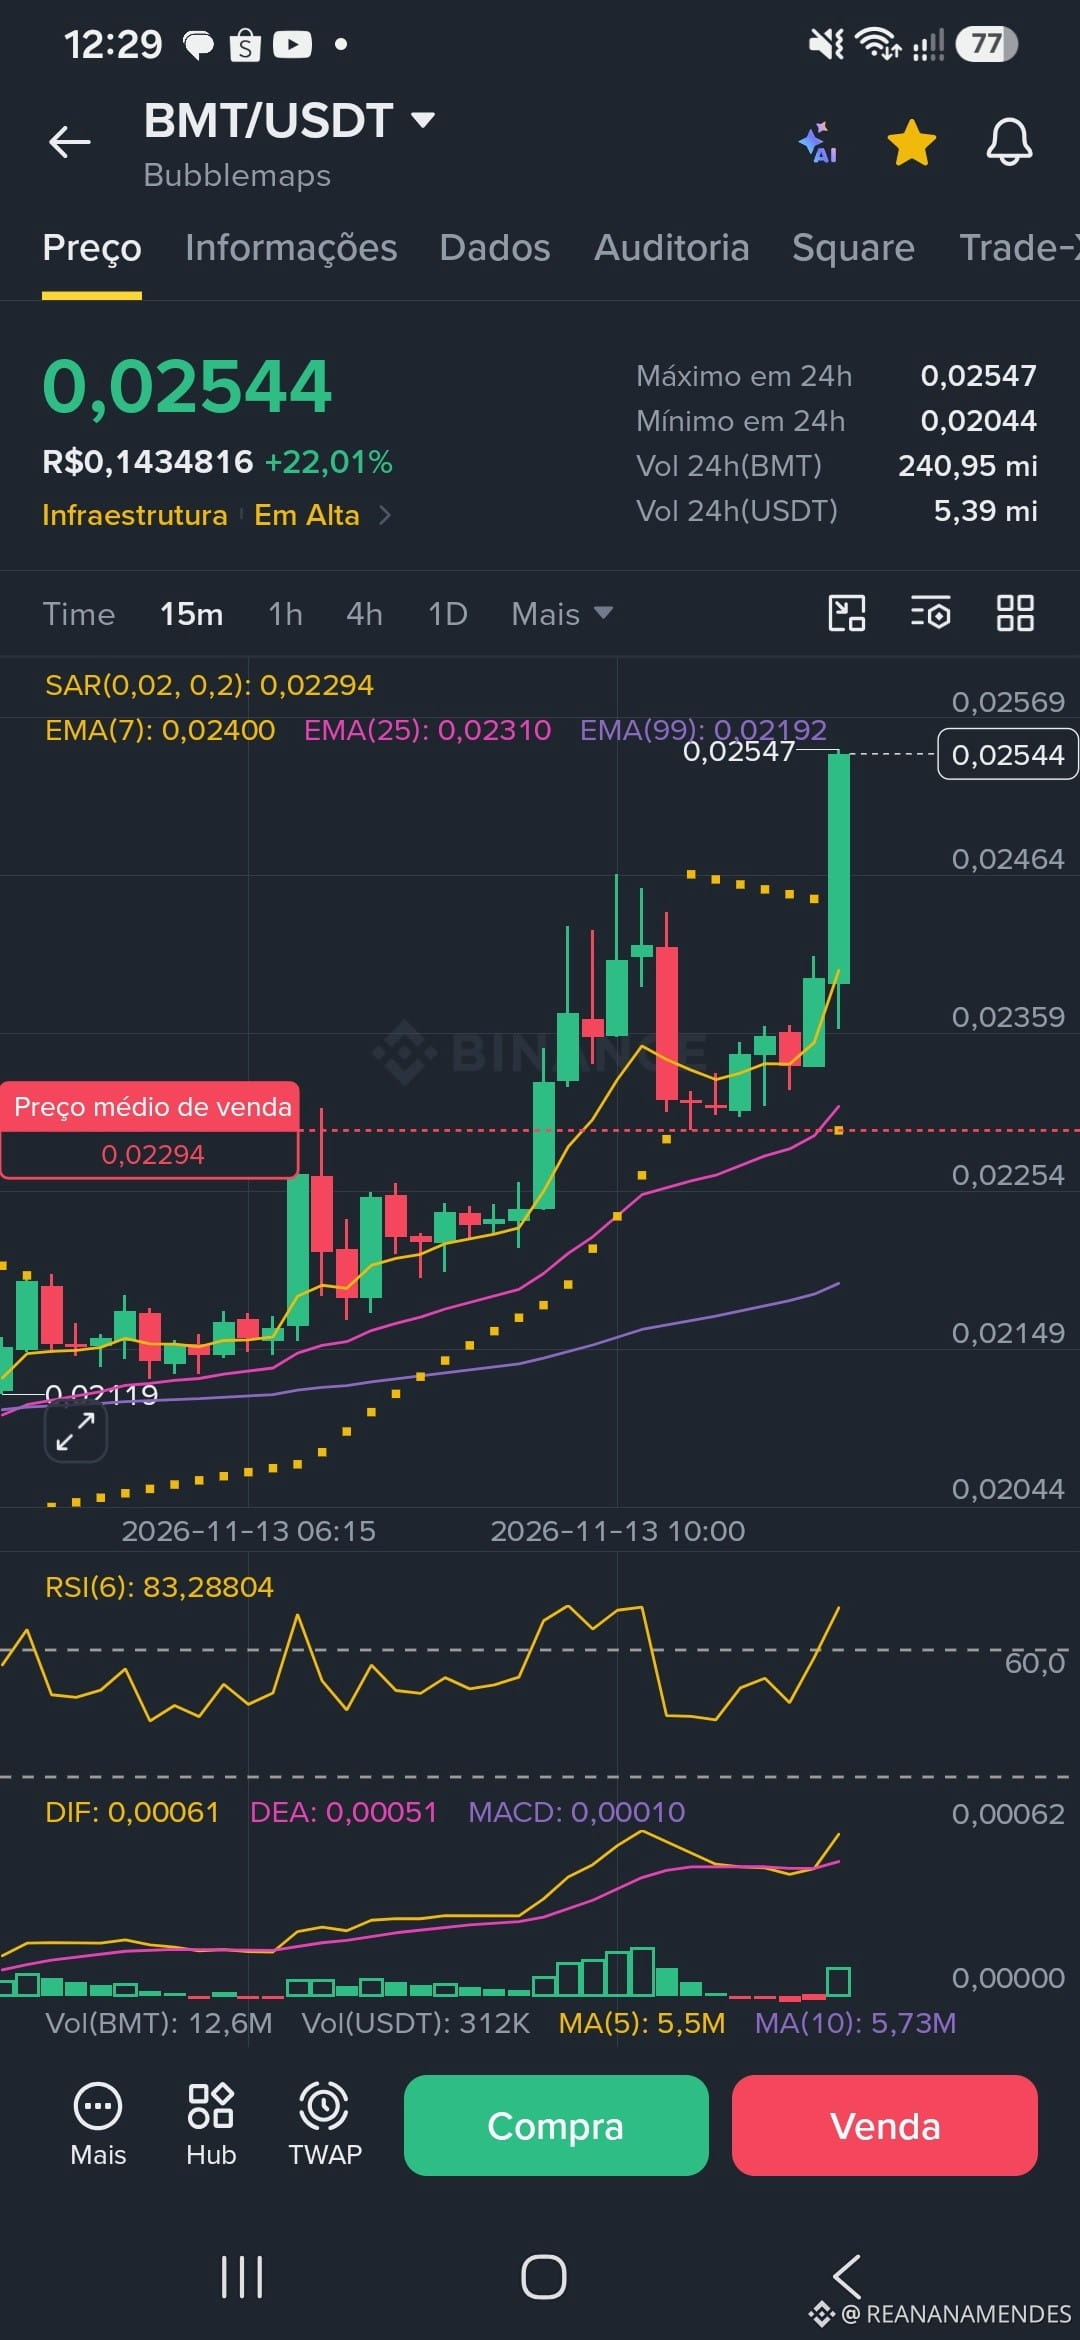
Current Price: ~$0.0254 – $0.0255
Change in the Last 24h: Up approximately +22%, driven by a strong intraday expansion in volume.
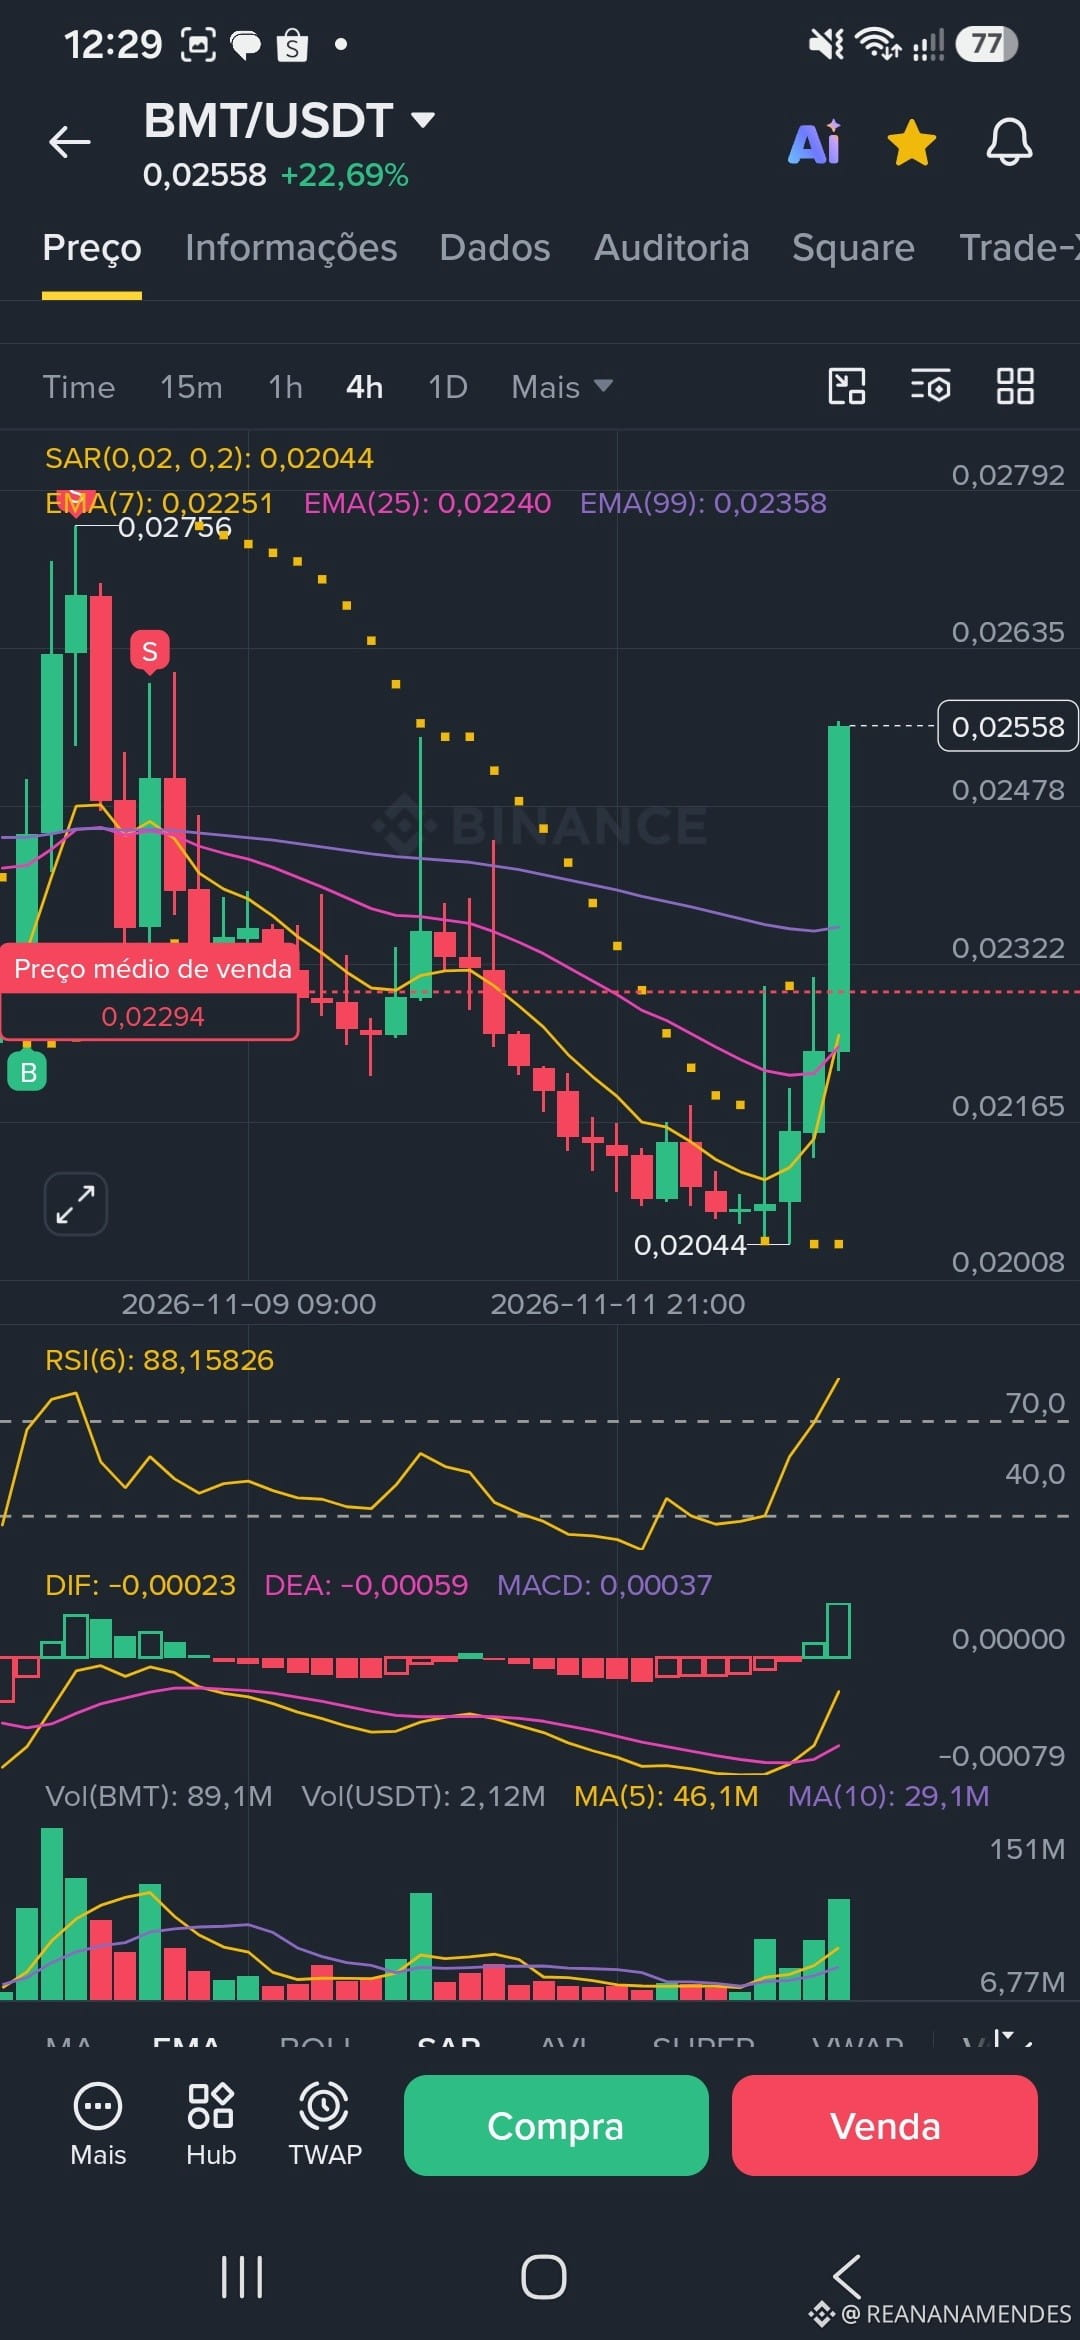
Exponential Moving Averages (EMA 7, 25, and 99): On the 4h chart, the shorter EMAs are beginning to curl upward, indicating an attempted trend reversal after the recent low at ~$0.0204. On the 15m chart, the price is already trading comfortably above the fast moving averages.
Parabolic SAR: On the 15m chart, the SAR dots have flipped below the price, confirming short-term bullish momentum. On the 4h chart, the indicator is beginning to test the possibility of a signal reversal.
RSI (Relative Strength Index): The 6-period RSI in the 83–88 range points to short-term overbought conditions, calling for extra caution against quick corrections or pullbacks to let the indicators cool off.
MACD: Positive histogram, with the signal lines (DIF/DEA) crossing upward in positive territory, confirming short-term buying strength.
🎯 Strategic Zones for Traders
For those scalping or making quick swing trades at these levels, the key areas to watch in the order book and price structure are:
Resistance / Targets (Take Profit):
R1: $0.0261 – $0.0275 (Recent high and area of strong previous selling pressure)
R2: $0.0300 (Psychological barrier and important short-term macro target)
Support / Defense Zones (Stop Loss):
S1: $0.0235 – $0.0240 (Former resistance turned immediate support)
S2: $0.0220 – $0.0204 (Previous low base and critical macro support on the 4h)
$BMT
The BMT/USDT pair is showing a very interesting chart setup on the short-term timeframes (15m and 4h), with a strong buying reaction after testing crucial support zones. Below is a complete X-ray of the asset to post in your feed:
🔍 Chart Overview and Indicators
Current Price: ~$0.0254 – $0.0255
Change in the Last 24h: Up approximately +22%, driven by a strong intraday expansion in volume.
Exponential Moving Averages (EMA 7, 25, and 99): On the 4h chart, the shorter EMAs are beginning to curl upward, indicating an attempted trend reversal after the recent low at ~$0.0204. On the 15m chart, the price is already trading comfortably above the fast moving averages.
Parabolic SAR: On the 15m chart, the SAR dots have flipped below the price, confirming short-term bullish momentum. On the 4h chart, the indicator is beginning to test the possibility of a signal reversal.
RSI (Relative Strength Index): The 6-period RSI in the 83–88 range points to short-term overbought conditions, calling for extra caution against quick corrections or pullbacks to let the indicators cool off.
MACD: Positive histogram, with the signal lines (DIF/DEA) crossing upward in positive territory, confirming short-term buying strength.
🎯 Strategic Zones for Traders
For those scalping or making quick swing trades at these levels, the key areas to watch in the order book and price structure are:
Resistance / Targets (Take Profit):
R1: $0.0261 – $0.0275 (Recent high and area of strong previous selling pressure)
R2: $0.0300 (Psychological barrier and important short-term macro target)
Support / Defense Zones (Stop Loss):
S1: $0.0235 – $0.0240 (Former resistance turned immediate support)
S2: $0.0220 – $0.0204 (Previous low base and critical macro support on the 4h)
$BMT